By Andrea Vale/Stacker

Whether a state is considered red or blue is only one side of the story. In many states, despite majority leanings, there are neighborhoods, towns, or even entire counties that hold steadfast against their neighbors and vote for the party that holds an opposing ideology to a majority of the state's residents.

Whether or not this means those enclaves will see the results they want depends on their state's unique circumstances. In many states, liberal areas are still subject to hyper-conservative policies designed to apply to the state at large. In Florida, for instance, Gov. Ron DeSantis has restricted discussions of gender identity in schools and passed one of the nation's narrowest abortion restrictions—both of which affect residents of the comparatively progressive Miami and Fort Lauderdale. In Ohio, preemption laws bar cities from regulating certain state-mandated issues, meaning that liberal pockets in Columbus and Toledo are still beholden to the conservative-majority gun laws and environmental policies.

Stacker compiled voter turnout data from The New York Times and statewide political ideology data from Gallup to rank states by their share of self-identifying conservatives. Ties were broken by the corresponding percentage of liberals, as able. Voter data was then used to identify counties that voted against this statewide average ideology.

Some "battleground" states that split relatively evenly between conservative and liberal didn't make either list. Detailed county voter turnout data was unavailable for Virginia, Alaska, Louisiana, and Alabama. For Washington D.C., ideological insights came from a study by the Pew Research Institute, rather than the Gallup data.

When looking at why an island of liberalism may exist in an otherwise heavily conservative state, there are typically a few reliable tells. Many of the counties included in this list are home to colleges or universities; this means relatively young and well-educated populations, which almost always equates to liberal leanings. The same is true for dense urban centers, which are usually home to higher concentrations of communities of color and foreign-born migrants—groups that also lean blue.

Native American communities often vote Democrat and are also often isolated within Republican-majority states; unsurprisingly, this is the case for more than a few counties included here. Even ski towns tend to transform a county into a stronghold for liberalism in otherwise conservative areas by attracting mostly upper-class, well-educated transplants as residents.

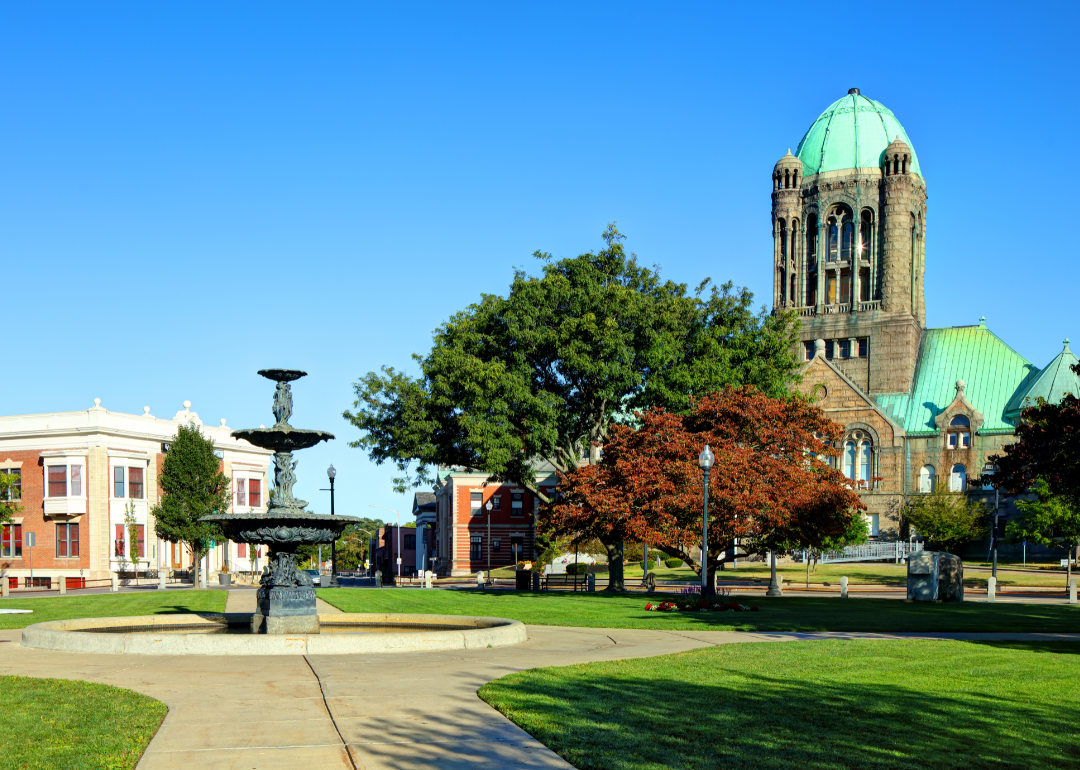
Read on to discover where liberal strongholds exist in otherwise staunchly conservative states, and what accounts for the unexpected shift from red to blue.Travis County, Texas

Canva

#19. Texas: 20% liberal, 38% conservative (tie)

- Most liberal county: Travis County
--- Democratic votes in 2020: 435,860 (71.4%)
--- Total votes cast: 610,349

Travis County—where the state capital of Austin can be found—represents a larger shift in many Texas counties towards the left, due in large part to a progressively younger population and incoming migration. As of 2022, just 10% of Travis County's population was 65 and older, and a full third of residents identified as Hispanic or Latino.Taos County, New Mexico
Canva

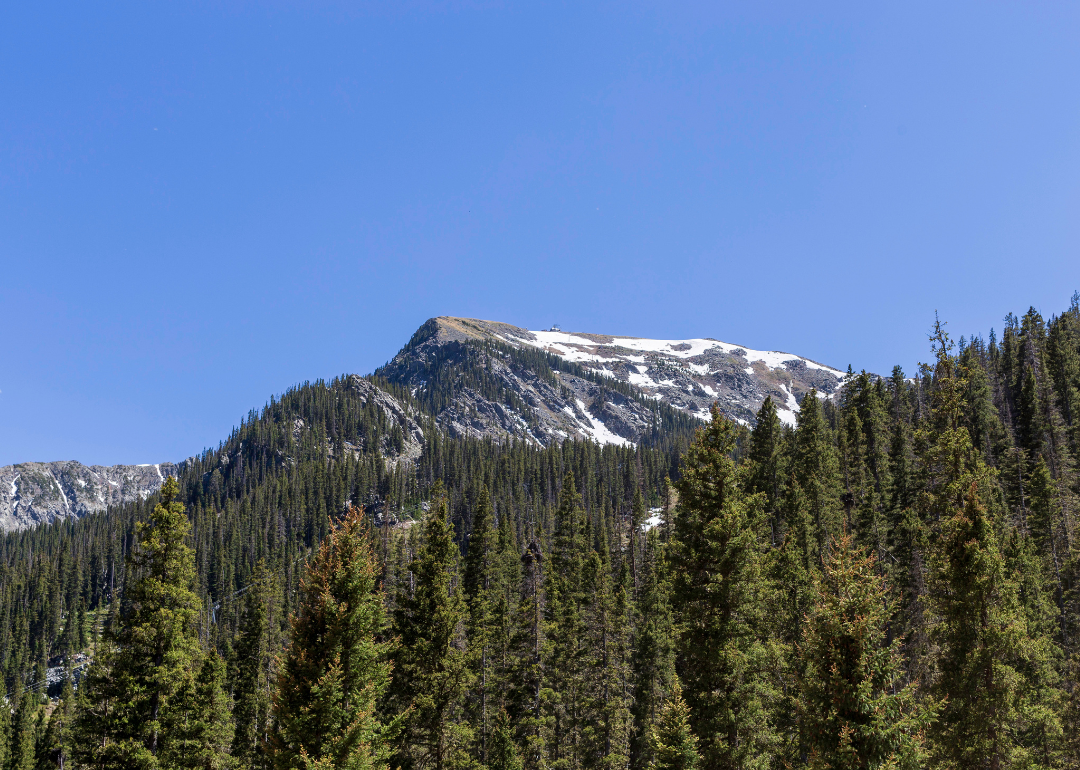
#19. New Mexico: 20% liberal, 38% conservative (tie)

- Most liberal county: Taos County
--- Democratic votes in 2020: 13,121 (76.4%)
--- Total votes cast: 17,181

Taos County comprises several Hispanic and Native American communities, resulting in a staunch Democratic leaning. Additionally, the county is home to the University of New Mexico-Taos, providing a concentration of young, well-educated voters that typically results in liberal tendencies.Durham County, North Carolina
Sean Pavone // Shutterstock

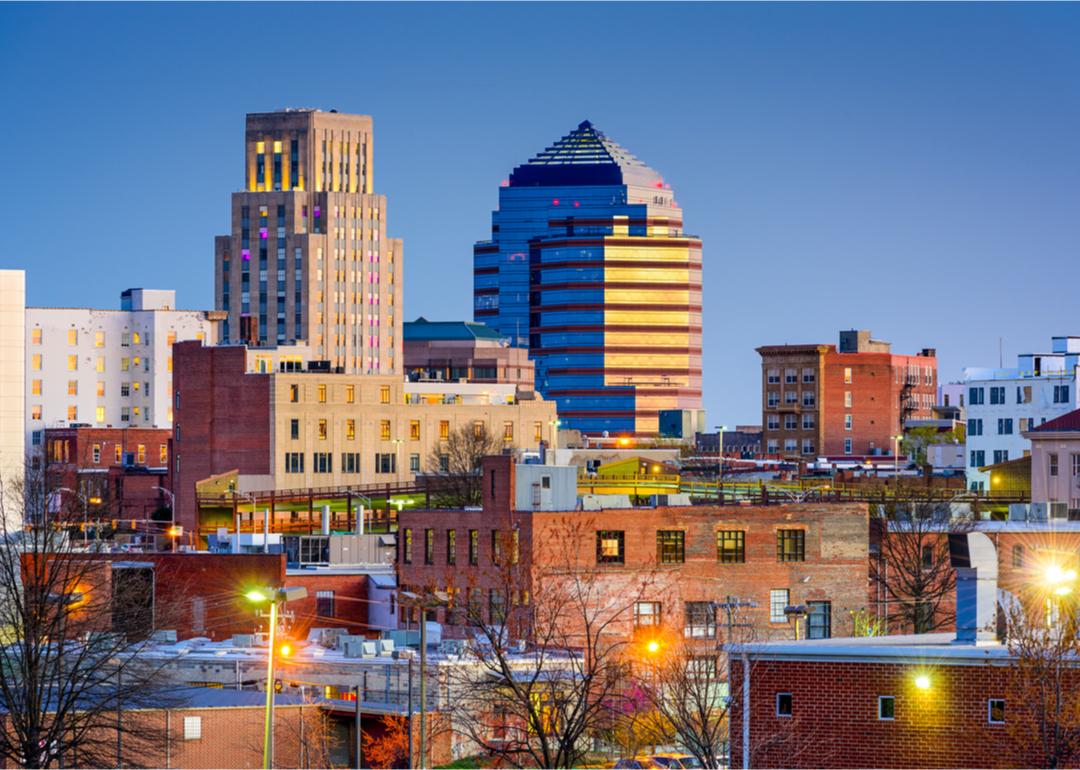
#18. North Carolina: 21% liberal, 39% conservative

- Most liberal county: Durham County
--- Democratic votes in 2020: 144,364 (80.4%)
--- Total votes cast: 179,594

Durham County's more liberal leaning is possibly due to its large concentration of urban centers and universities. The county holds the cities of Durham and parts of Raleigh, as well as most of the state's most well-known institutes of higher education, including Duke University, North Carolina Central University, and Durham Technical Community College.Jefferson County, Kentucky

f11photo // Shutterstock

#17. Kentucky: 20% liberal, 39% conservative

- Most liberal county: Jefferson County
--- Democratic votes in 2020: 228,272 (59.1%)
--- Total votes cast: 386,061

Jefferson County is the most heavily populated county in the state—it is home to more than 780,000 residents, while the next-largest, Fayette County, has less than half that count—and includes Louisville, the state's largest city. Besides a dense population, the county is also home to a heavy concentration of universities and colleges, with one college per 11 square miles.Clayton County, Georgia
Josemejia // Shutterstock

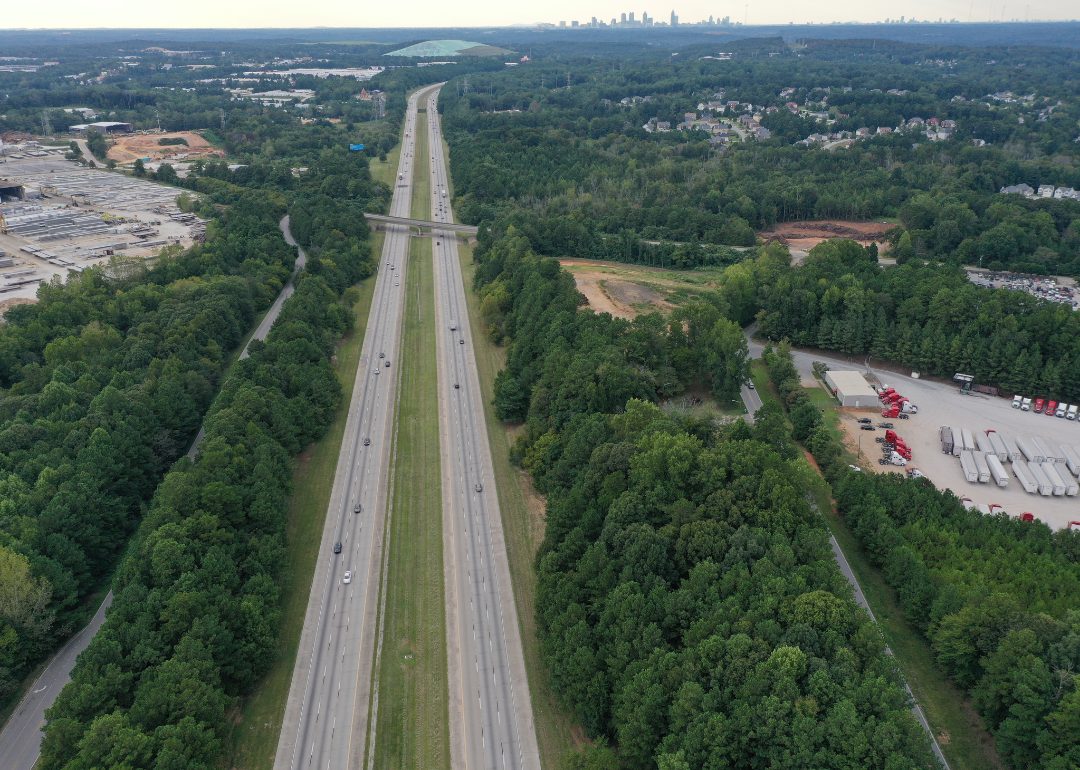
#16. Georgia: 19% liberal, 39% conservative

- Most liberal county: Clayton County
--- Democratic votes in 2020: 95,476 (85.0%)
--- Total votes cast: 112,344

Clayton County is a particularly diverse area, with 73.4% of its population self-identifying as Black and 13.5% as Hispanic or Latino. This accounts for its uniquely Democratic leaning; though previously a swing county, the increasing number of Black Americans and other people of color relocating to the county has shifted it to staunchly liberal.Douglas County, Kansas
Canva

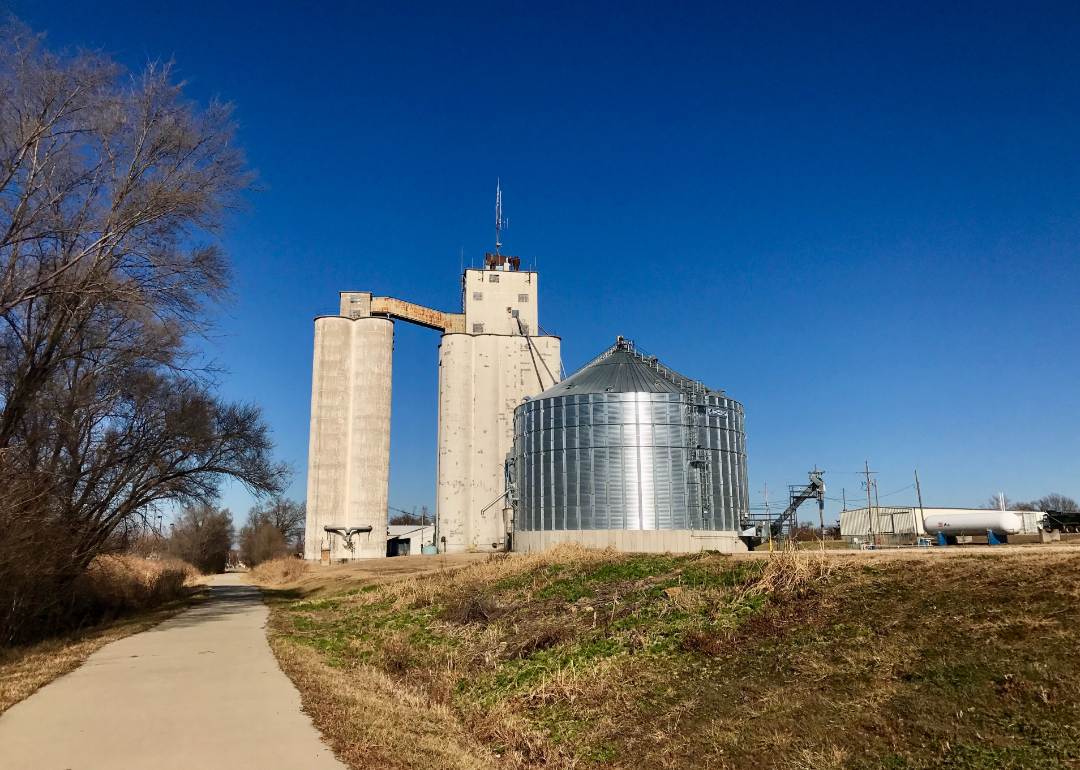
#13. Kansas: 18% liberal, 39% conservative (tie)

- Most liberal county: Douglas County
--- Democratic votes in 2020: 40,785 (68.6%)
--- Total votes cast: 59,495

Douglas County's blue dominance is owed in large part to encompassing the city of Lawrence, widely perceived as a liberal college town. Lawrence is home to the University of Kansas, which self-describes as "the state's flagship institution." Douglas County is particularly young and upper-middle-class: just 13.5% of the population is over 65, and the median household income is $62,594.Glacier County, Montana

Dirk Wierenga // Shutterstock

#13. Montana: 18% liberal, 39% conservative (tie)

- Most liberal county: Glacier County
--- Democratic votes in 2020: 3,610 (64.3%)
--- Total votes cast: 5,617

Home to the Blackfeet Indian Reservation, Glacier County residents are majority Native American, with 64.6% of the county's 13,681 residents self-identifying as American Indian or Alaska Native. Native American communities tend to lean more liberal than conservative, making this county a stronghold for Democrats, even while surrounded by red-voting counties.Sioux County, North Dakota
Joseph Sohm // Shutterstock

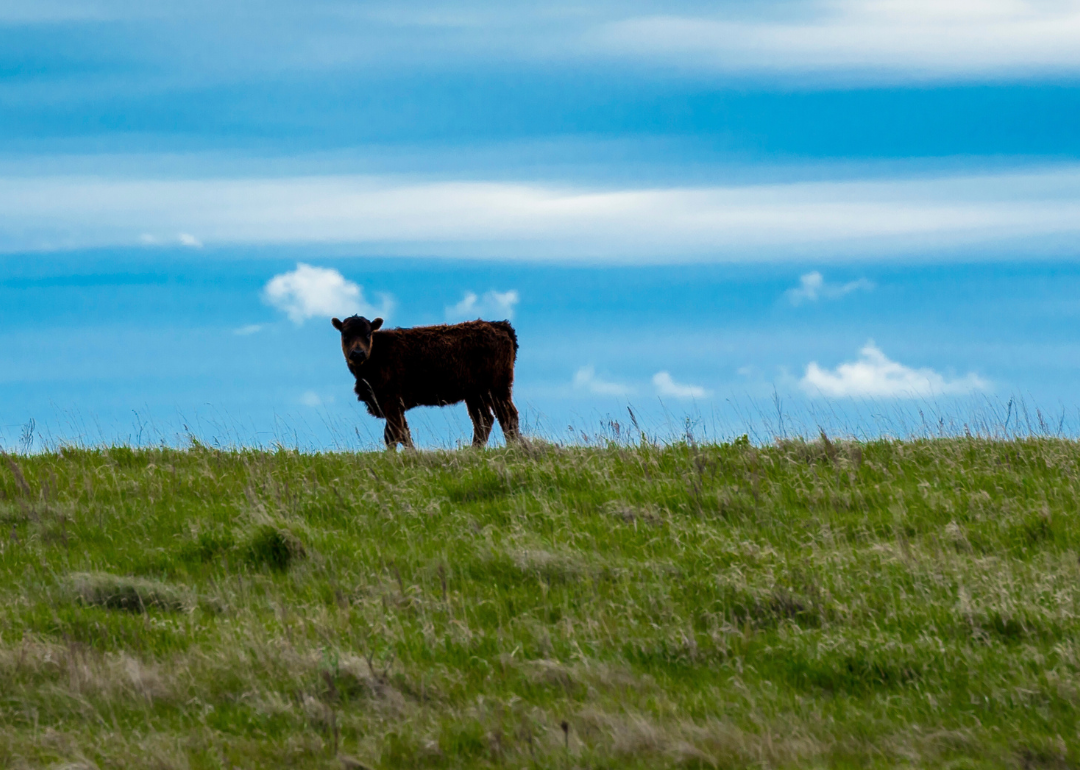
#13. North Dakota: 18% liberal, 39% conservative (tie)

- Most liberal county: Sioux County
--- Democratic votes in 2020: 804 (67.8%)
--- Total votes cast: 1,186

Like Glacier County in Montana, Sioux County's large proportion of Native American residents accounts for its liberal skew. Though the tiny area only has 3,711 residents, 83.1% of them are American Indian or Alaska Native.Marion County, Indiana

Sean Pavone // Shutterstock

#12. Indiana: 17% liberal, 39% conservative

- Most liberal county: Marion County
--- Democratic votes in 2020: 247,772 (63.6%)
--- Total votes cast: 389,618

Marion County is home to the state's most populous city, Indianapolis, as well as several universities. This makes the region comparatively urban and young when measured against surrounding central Indiana counties. Additionally, the county is relatively more diverse than nearby majority-white areas, with a 29.6% Black population, compared to 10.2% in the state in general.Blaine County, Idaho
Canva

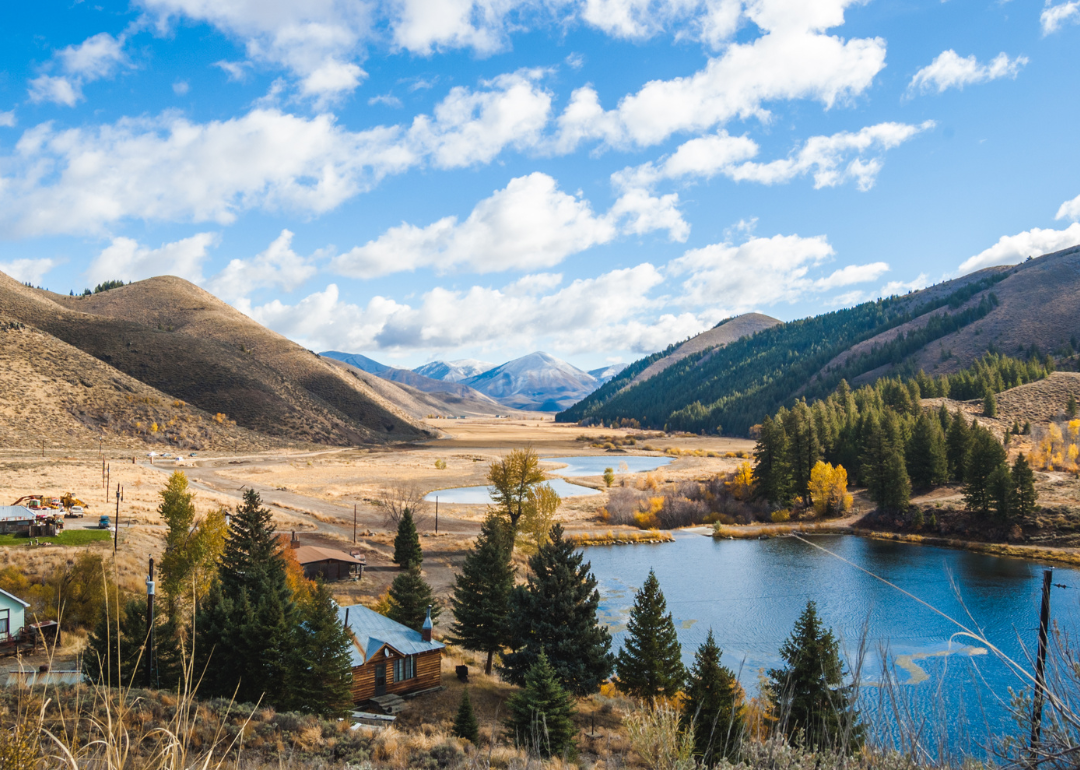
#11. Idaho: 17% liberal, 40% conservative

- Most liberal county: Blaine County
--- Democratic votes in 2020: 8,919 (67.1%)
--- Total votes cast: 13,289

Though not home to the state's most populated cities, Blaine County does have one notable locale that is thought to largely account for its reputation as a Democratic stronghold: the Sun Valley ski resort. The county is subsequently home to a large number of out-of-staters who choose to live part-time or retire there, and who are usually upper-class, well-educated, and white. 94.4% of Blaine County residents are white, and the median household income is $71,749.St. Louis city, Missouri

Sean Pavone // Shutterstock

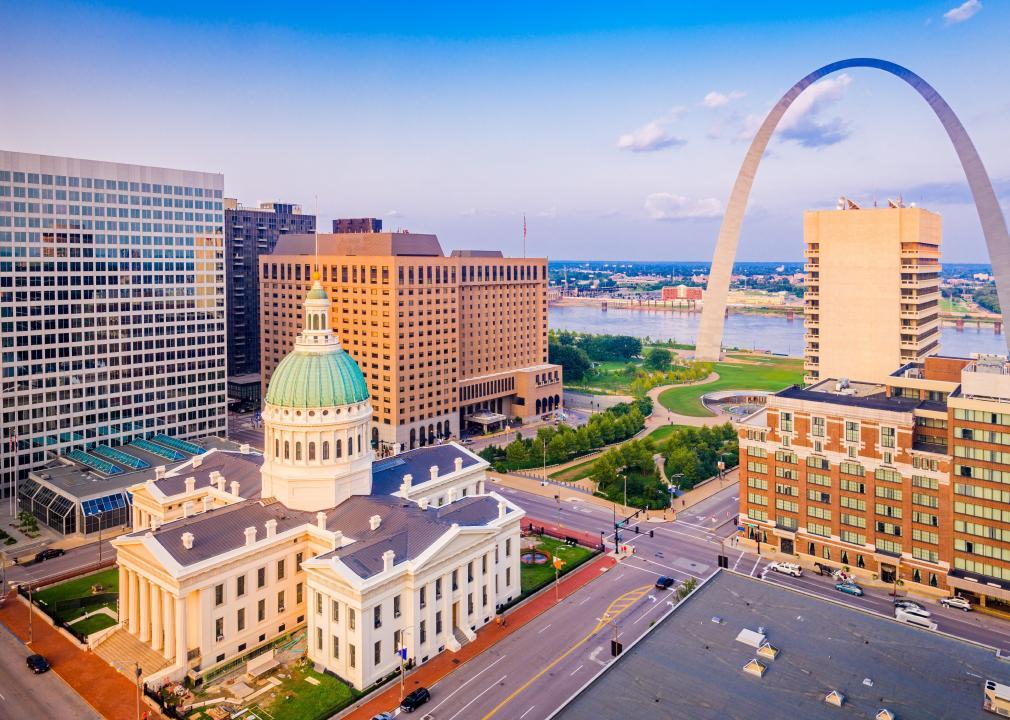
#10. Missouri: 20% liberal, 41% conservative

- Most liberal county: St. Louis
--- Democratic votes in 2020: 110,089 (82.3%)
--- Total votes cast: 133,793

Home to nearly 1 million residents, St. Louis County (not to be confused with the independent city of St. Louis, which belongs to no county) is diverse, well-educated, urban, and affluent compared to other parts of the state. Only 67.4% of the population is white alone; 25.1% is Black. The median household income is $72,562. Additionally, the county is home to a large concentration of institutes of higher education, including Washington University in St. Louis, Saint Louis University, and Maryville University.Allendale County, South Carolina
Bennekom // Shutterstock

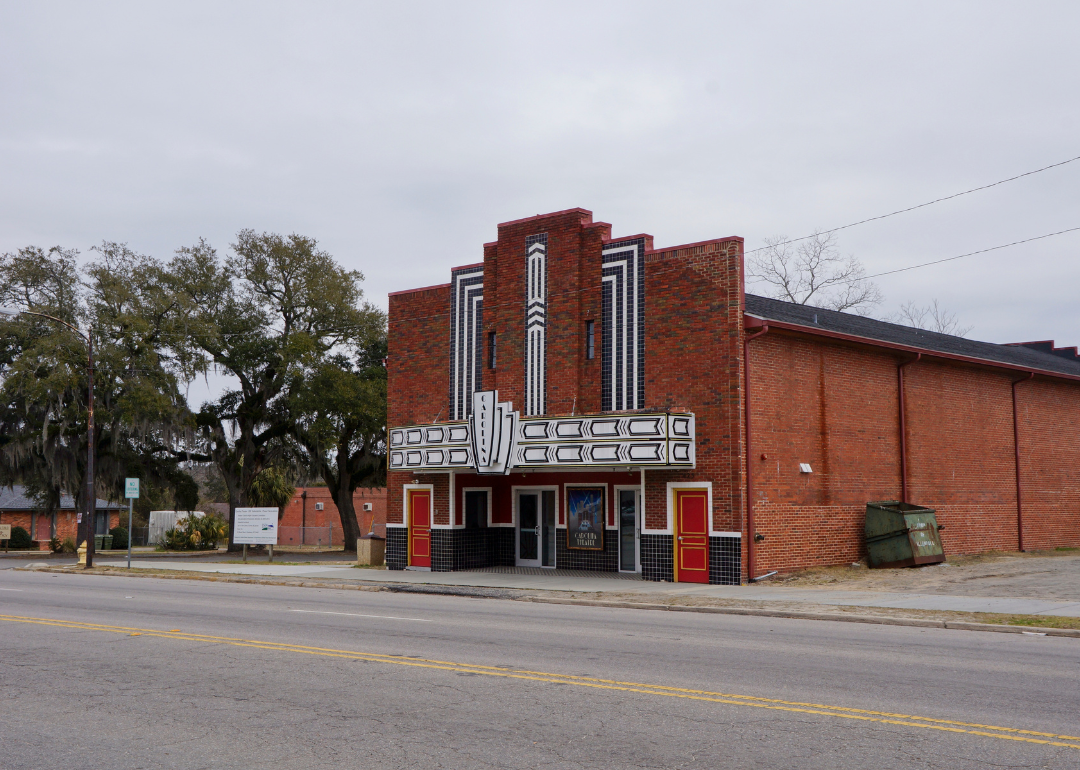
#9. South Carolina: 16% liberal, 41% conservative

- Most liberal county: Allendale County
--- Democratic votes in 2020: 2,714 (75.7%)
--- Total votes cast: 3,585

Though Allendale is the smallest and among the most poor and rural counties in the state, it is also one of the most politically active. Though these superlatives would usually tilt a county towards conservatism, Allendale County is also majority (72.7%) Black, and the region's lack of dependable health care, employment, and transportation has led to widespread support for Democratic initiatives like Medicaid.Pulaski County, Arkansas
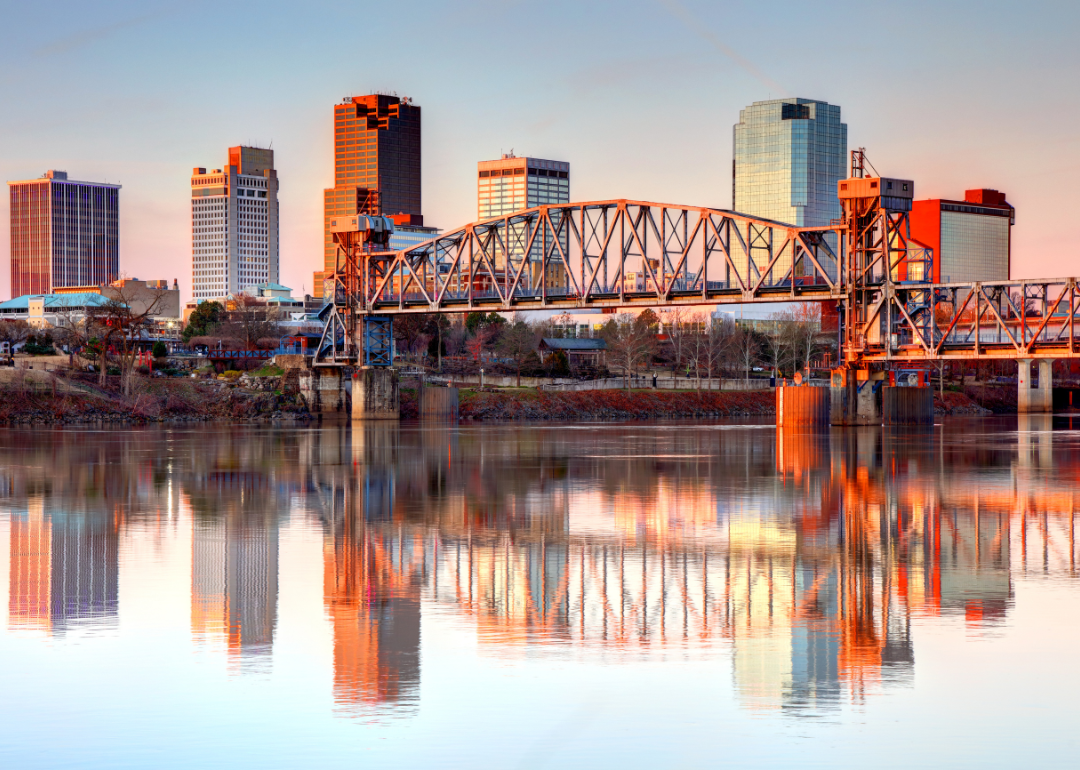
Canva

#7. Arkansas: 15% liberal, 41% conservative (tie)

- Most liberal county: Pulaski County
--- Democratic votes in 2020: 101,947 (60.0%)
--- Total votes cast: 169,956

The most populous county in the state and home to the capital city of Little Rock, Pulaski County is relatively diverse and young. Only 50% of residents are white, while 37% are Black; the median age is around 38.Summit County, Utah
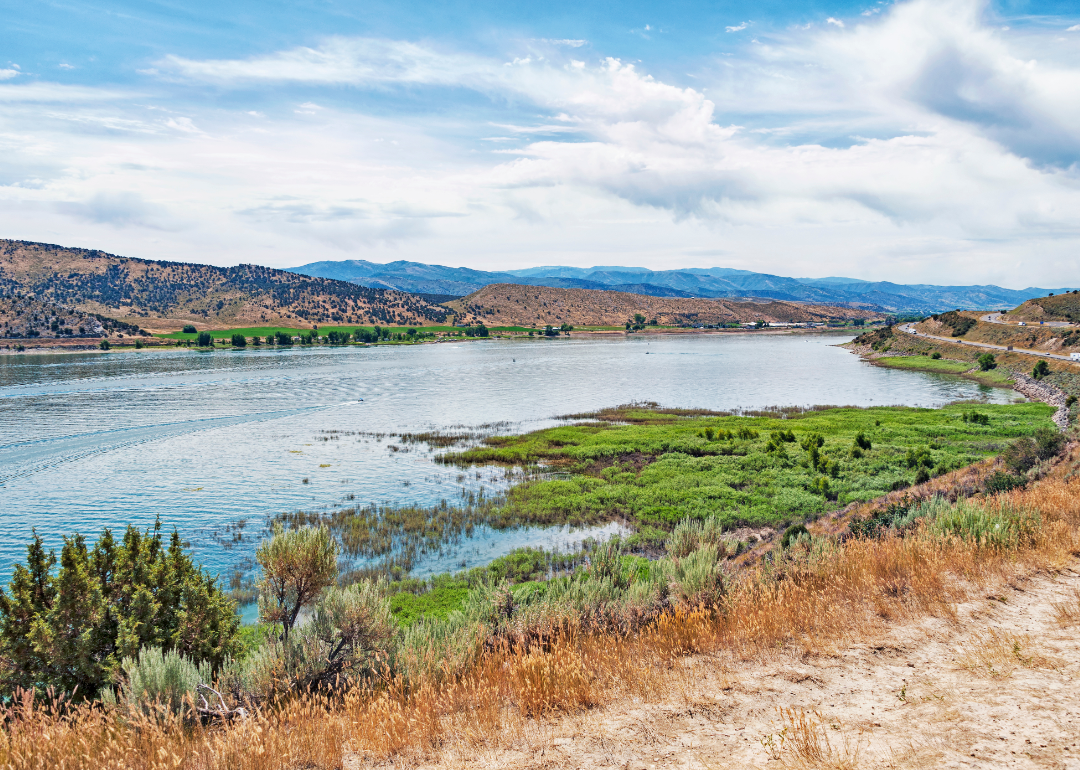
Canva

#7. Utah: 15% liberal, 41% conservative (tie)

- Most liberal county: Summit County
--- Democratic votes in 2020: 15,244 (58.0%)
--- Total votes cast: 26,289

Summit County is the most liberal area in the state thanks mostly to the urban center of Park City, which makes up 8,576 of the county's 43,036 residents. While Park City is "staunchly liberal," other areas within the county itself lean more conservative. In the ski resort town of Park City, however, upper-class, well-educated residents have huge sway. With an average income of $91,470, Park City is the country's second-wealthiest small urban area.Cleveland County, Oklahoma
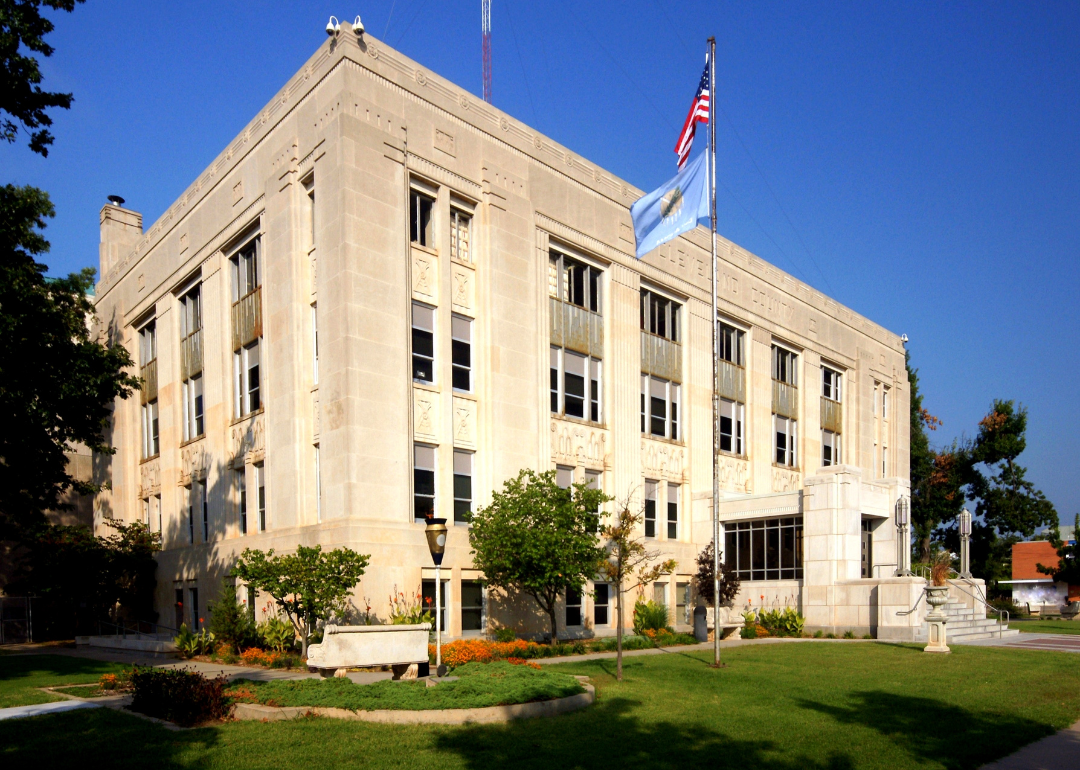
Canva

#6. Oklahoma: 18% liberal, 43% conservative

- Most liberal county: Cleveland County
--- Democratic votes in 2020: 49,827 (41.6%)
--- Total votes cast: 119,778

Cleveland County's urban and educational hubs account for its ranking as the bluest county in the state. The county is part of the state's largest metro area (Oklahoma City) and the state's largest university (the University of Oklahoma). Additionally, the county is slightly more educated (34.98% of adults have bachelor's degrees or higher) and younger (the median age is 37.3) than surrounding areas, which both correlate with higher populations of liberals.Shelby County, Tennessee

Canva

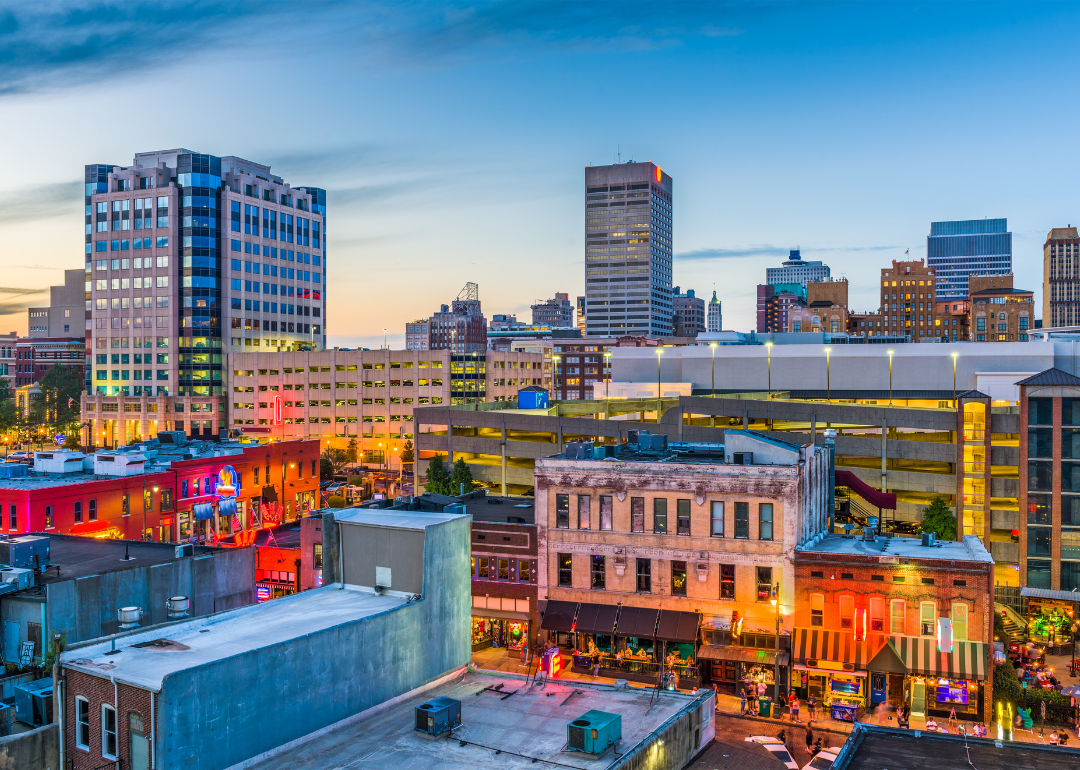
#5. Tennessee: 17% liberal, 43% conservative

- Most liberal county: Shelby County
--- Democratic votes in 2020: 246,105 (64.4%)
--- Total votes cast: 382,055

Shelby County has three standout qualities that place it squarely in the blue. First, it is home to a large urban center (Memphis, with a population of over 600,000). Secondly, its population is majority Black, accounting for 54.6% of residents. Finally, it contains a large concentration of colleges and universities, including the University of Memphis, Rhodes College, Remington College, and the University of Tennessee Health Sciences Center.Oglala Lakota County, South Dakota

Canva

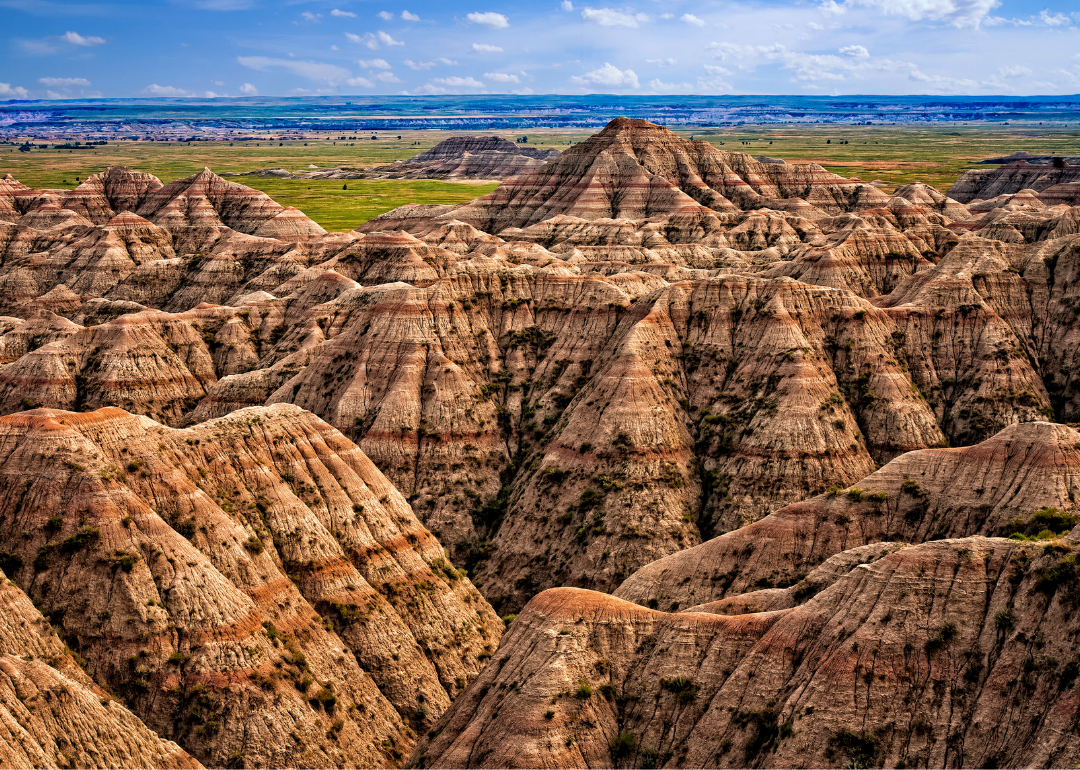
#4. South Dakota: 13% liberal, 44% conservative

- Most liberal county: Oglala Lakota County
--- Democratic votes in 2020: 2,829 (88.4%)
--- Total votes cast: 3,200

Like other areas that are predominantly populated by Native Americans, Oglala Lakota is a Democratic stronghold in a Republican state (much like Glacier County, Montana, and Sioux County, North Dakota). 92.3% of the population is American Indian or Native Alaskan, which is unsurprising considering the entire county sits within the Pine Ridge Indian Reservation.Monongalia County, West Virginia
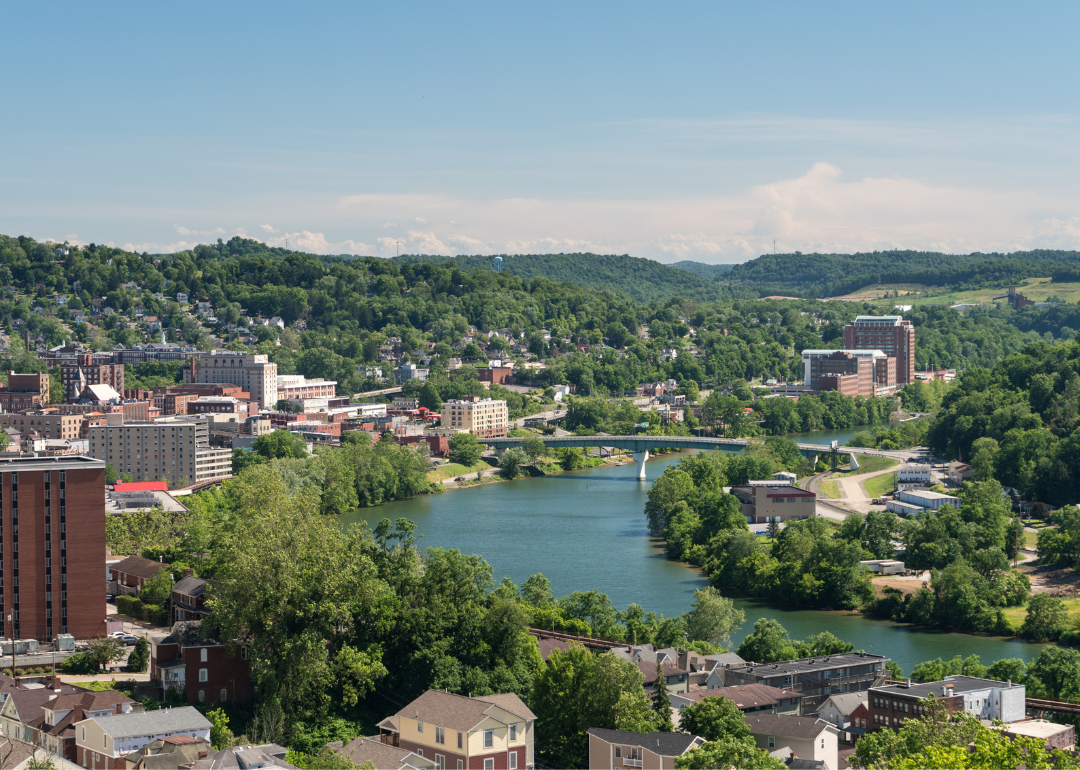
Canva

#3. West Virginia: 17% liberal, 45% conservative

- Most liberal county: Monongalia County
--- Democratic votes in 2020: 20,282 (48.2%)
--- Total votes cast: 42,072

Monongalia County is home to Morgantown, a city that is growing starkly white-collar and well-educated compared to other areas of the state—and consequently, starkly liberal as well. Like many other college towns, Morgantown—home to West Virginia University—is generally younger, more affluent, and more Democratic than more rural areas.Teton County, Wyoming

C Rolan // Shutterstock

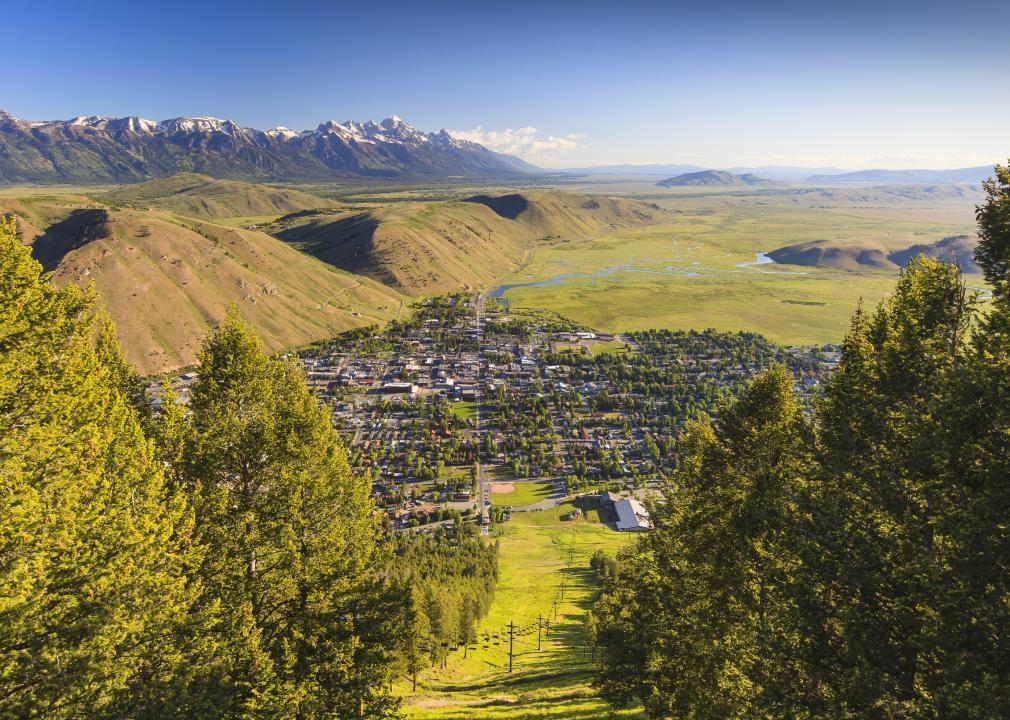
#2. Wyoming: 18% liberal, 46% conservative

- Most liberal county: Teton County
--- Democratic votes in 2020: 9,848 (67.1%)
--- Total votes cast: 14,677

While Wyoming writ large is rural and agricultural, Teton County—which contains the Jackson ski resort—is a "playground for the ultra-rich," largely accounting for its liberal leanings. Like Park City, Utah, and Blaine County, Idaho, ski towns come with wealth, and with wealth comes Democrats: the median income in Teton County is a whopping $94,498.Jefferson County, Mississippi
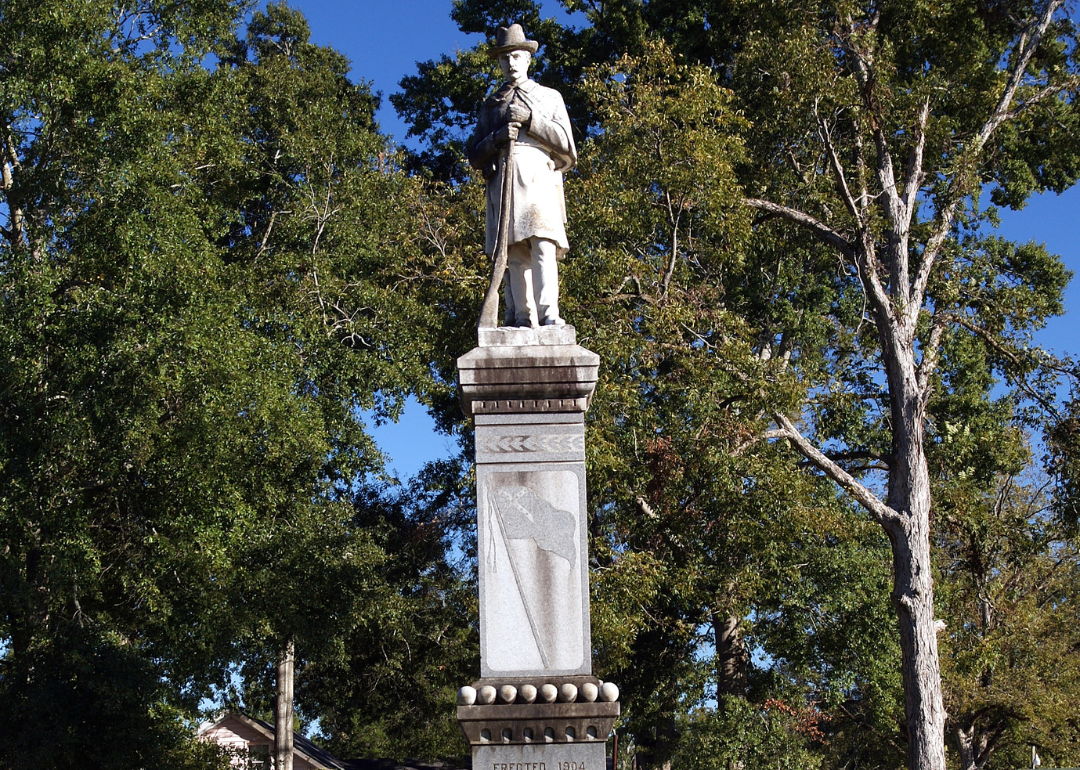
Canva

#1. Mississippi: 12% liberal, 50% conservative

- Most liberal county: Jefferson County
--- Democratic votes in 2020: 3,327 (86.1%)
--- Total votes cast: 3,863

Though increasingly sparsely populated and mired in poverty, Jefferson County is also diverse. 84.9% of the population is Black, accounting for the region's liberal character.

Data reporting by Sam Larson. Story editing by Brian Budzynski. Copy editing by Tim Bruns. 

_____
COMMENT below or email editors@thehustings.news
By Elias Sorich/Stacker

American politics have polarized faster than in other democracies, according to a report published in the National Bureau of Economic Research. This trend is reflected in the ideological movement of the U.S. Congress, with both Democrats and Republicans moving further and further away from an ideological center, though Republicans have done so on average more intensely. Indeed, the recent struggle of Republican House Majority Leader Kevin McCarthy to gain the speakership role highlighted the degree to which hard-right conservative politicians have come to hold disproportionately large sway over the Republican majority.

Many of those detractors, members of the Freedom Caucus, come from reliably Republican and ideologically conservative states, though a number come from more moderate or swing states. To develop an understanding of the complexity of the American political landscape, Stacker compiled voter turnout data from The New York Times and statewide political ideology data from Gallup to rank states by their share of self-identifying liberals. Ties were broken by the corresponding percentage of conservatives, as able. Voter data was then used to identify counties that voted against this statewide average ideology.

In looking at these counties, data from government agencies such as the Census Bureau and research institutes—such as the Pew Research Center and the Public Religion Research Institute—were used to highlight and analyze demographic factors that might make the political ideology of the county apparent. Percentages of people identifying as "white Christian" in each county were sourced from the 2020 Census of American Religion. Detailed voter turnout data was unavailable for Virginia, Alaska, Louisiana, and Alabama.

In terms of understanding how these demographic factors affect the political lean of an American voter, a few qualities stand out as the biggest and most reliable predictors of party affiliation and ideological tendency. Namely, religion, race, education, and where a voter falls on the urban-rural divide. To distill these complexities into a couple of takeaways: Racially diverse communities lean Democrat by wide margins, and white Christians account for a large percentage of Republican votes. The highly educated tend to lean Democrat quite broadly, and in presidential elections, rural areas see a 15-22 point increase in Republican votes regardless of other variables such as race and education. Gender, age, and sexuality all play into the equation as well, with older voters leaning conservative, women leaning Democrat, men leaning slightly Republican, and LGBTQ+ voters overwhelmingly liberal.Florence County, Wisconsin

ehrlif // Shutterstock

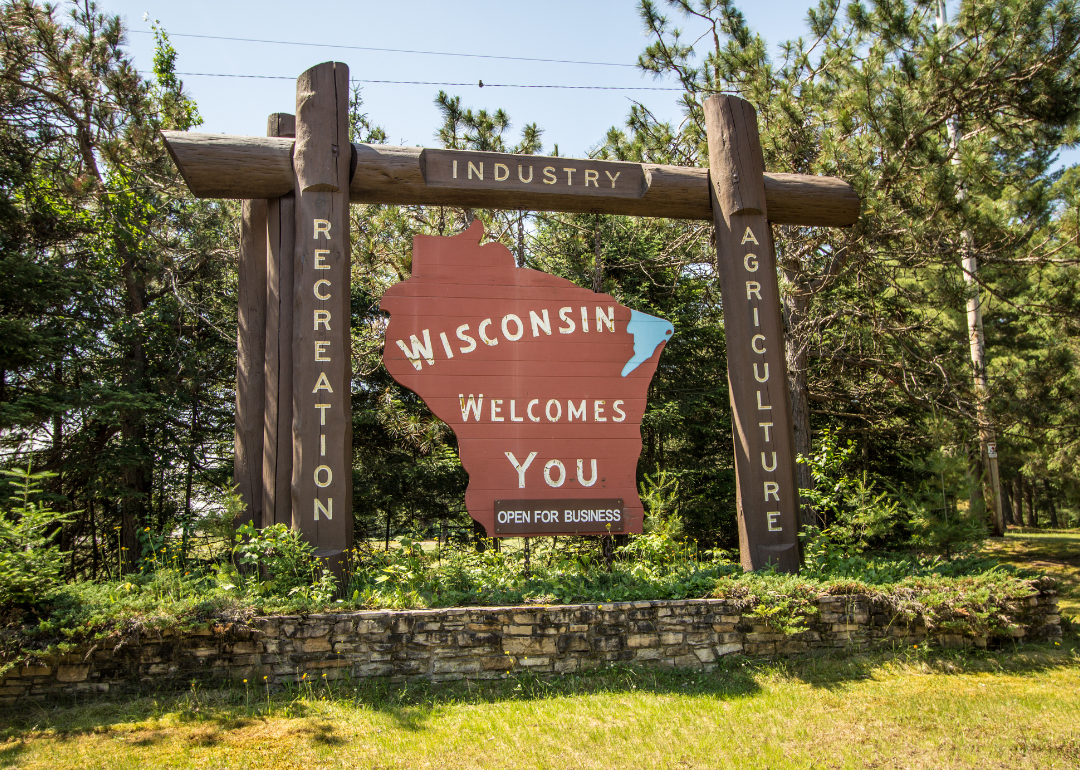
#20. Wisconsin: 24% liberal, 35% conservative

- Most conservative county: Florence County
--- Republican votes in 2020: 2,133 (72.6%)
--- Total votes cast: 2,940

Located on the northernmost, rural border between Wisconsin and Michigan, Florence County has a population of 4,558, of which 94.6% is white, most of whom identify as white and Christian. The county has a population density of 9.3 people per square mile, a median age 15.9 years higher than the national average of 38.6, and 20.6% of its population has attained a bachelor's degree or higher, 14.4% lower than the national average of 35%.Fulton County, Pennsylvania

Alejandro Guzmani // Shutterstock

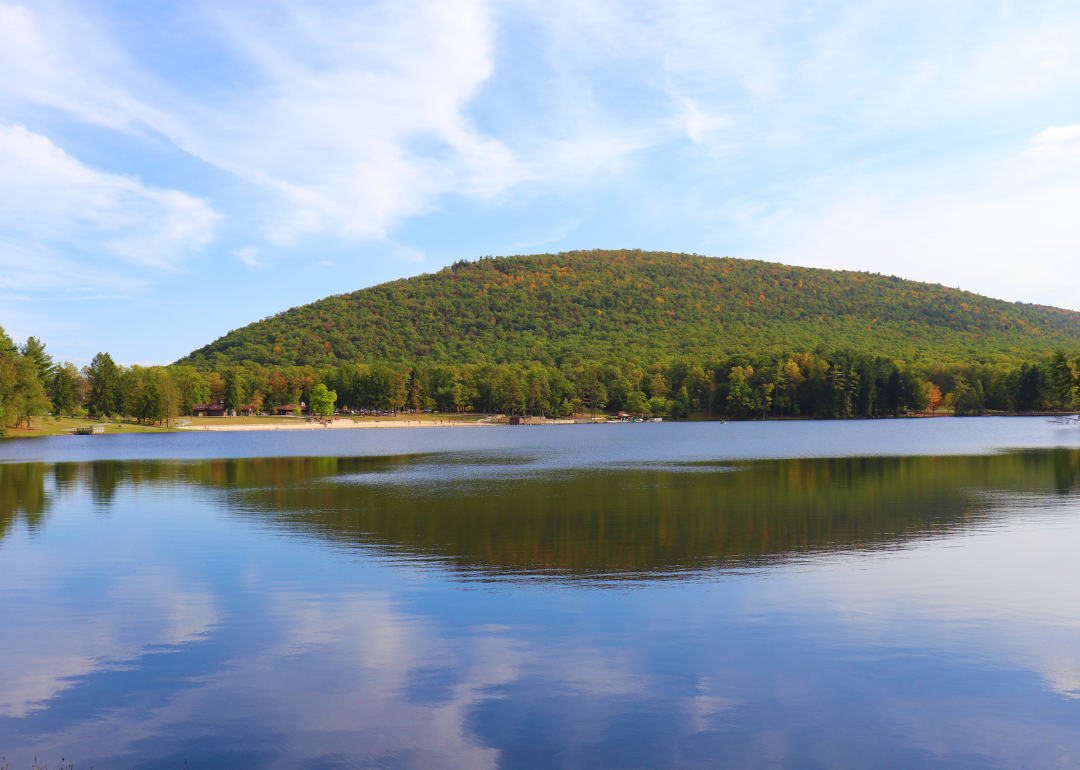
#19. Pennsylvania: 24% liberal, 34% conservative

- Most conservative county: Fulton County
--- Republican votes in 2020: 6,824 (85.4%)
--- Total votes cast: 7,990

Fulton County shares a border with Maryland to the south and is sparsely populated, with McConnellsburg (population 1,150) its largest town. In terms of explaining conservative dominance in the county, three demographics stand out: its population of 14,556 is 94.3% white, only 15.7% of residents have a bachelor's degree or higher, and 80% of the population identifies as white Christian.Sussex County, Delaware

Canva

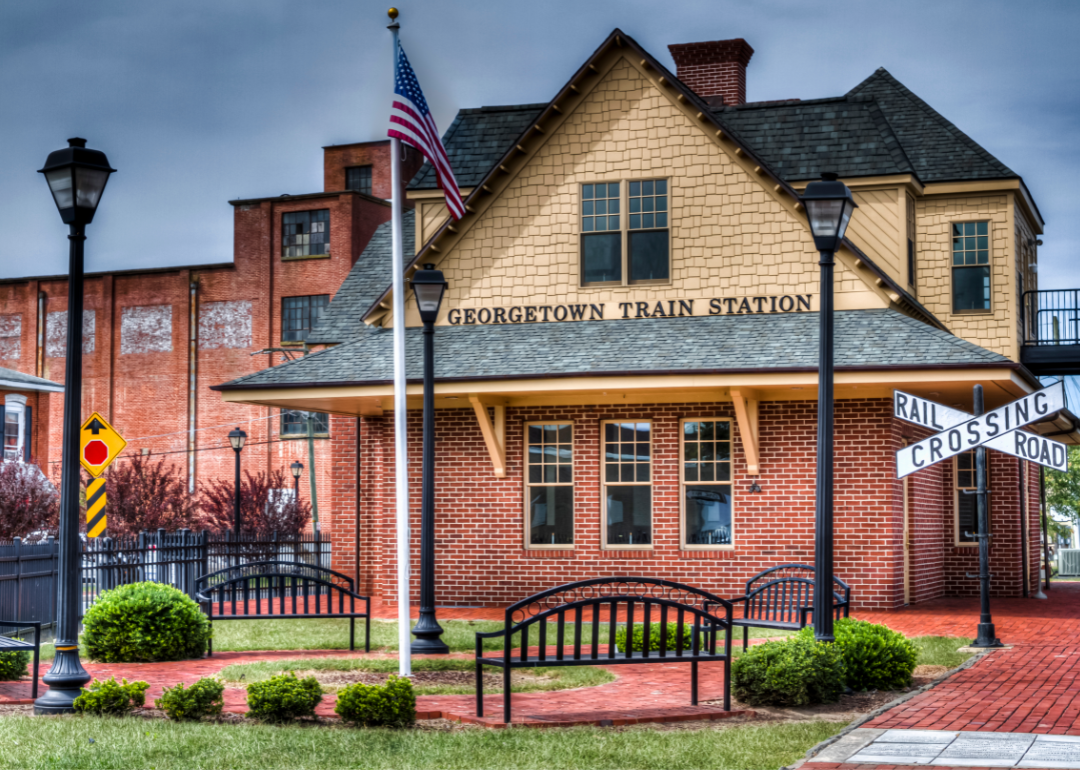
#18. Delaware: 24% liberal, 29% conservative

- Most conservative county: Sussex County
--- Republican votes in 2020: 71,230 (55.1%)
--- Total votes cast: 129,352

Distinguishing Sussex County most significantly from its more liberal neighboring counties is the high median age of its residents at 51.8 years, with 29.8% of Sussex County residents being 65 and older, and 75.4% of its 237,378 residents identifying as white. Immediately north is Kent County, Delaware, which has a median age of 38.8, and a lower percentage of white residents at 58.8% of 181,851. While not as markedly white as other counties, Sussex's racial demographics, combined with the fact that older voters generally vote more conservatively, likely contribute to its Republican lean.Morrison County, Minnesota

Canva

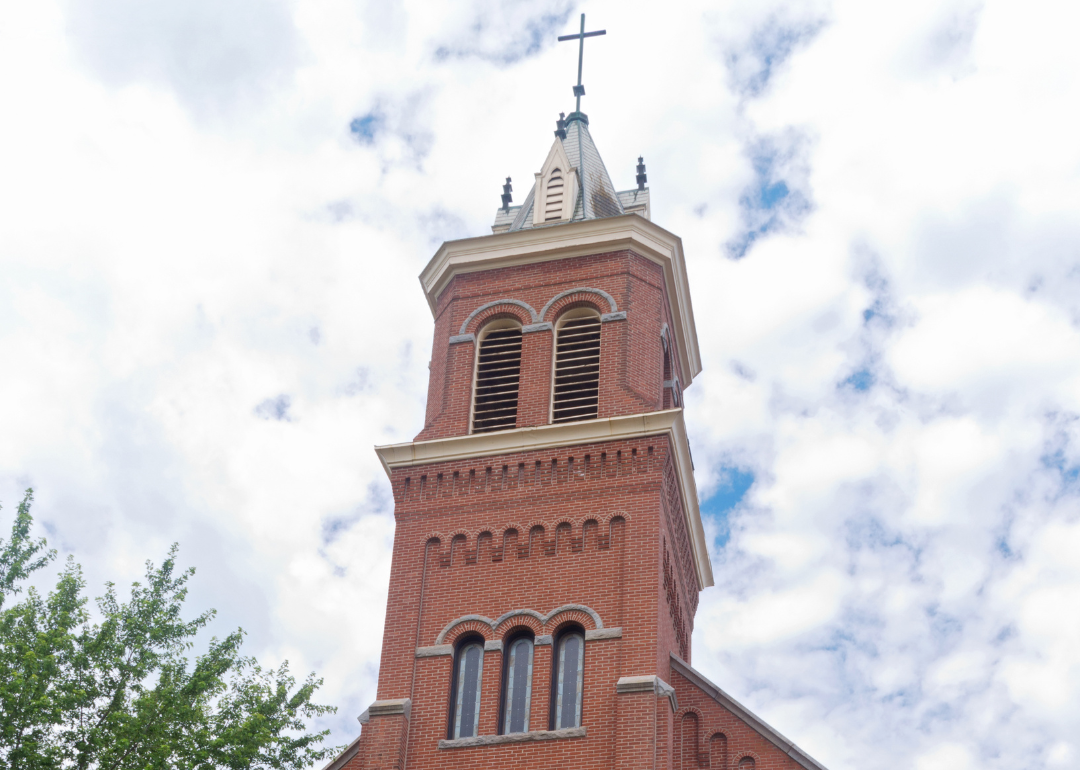
#17. Minnesota: 25% liberal, 32% conservative

- Most conservative county: Morrison County
--- Republican votes in 2020: 14,821 (75.8%)
--- Total votes cast: 19,558

One of the top counties in Minnesota for dairy farming, Morrison County has a population of 34,010 with a density of 29.5 people per square mile, making it a decidedly rural region. In terms of demographics, the county is 94.2% white, a recurring factor in sharply conservative counties.Kent County, Rhode Island

Canva

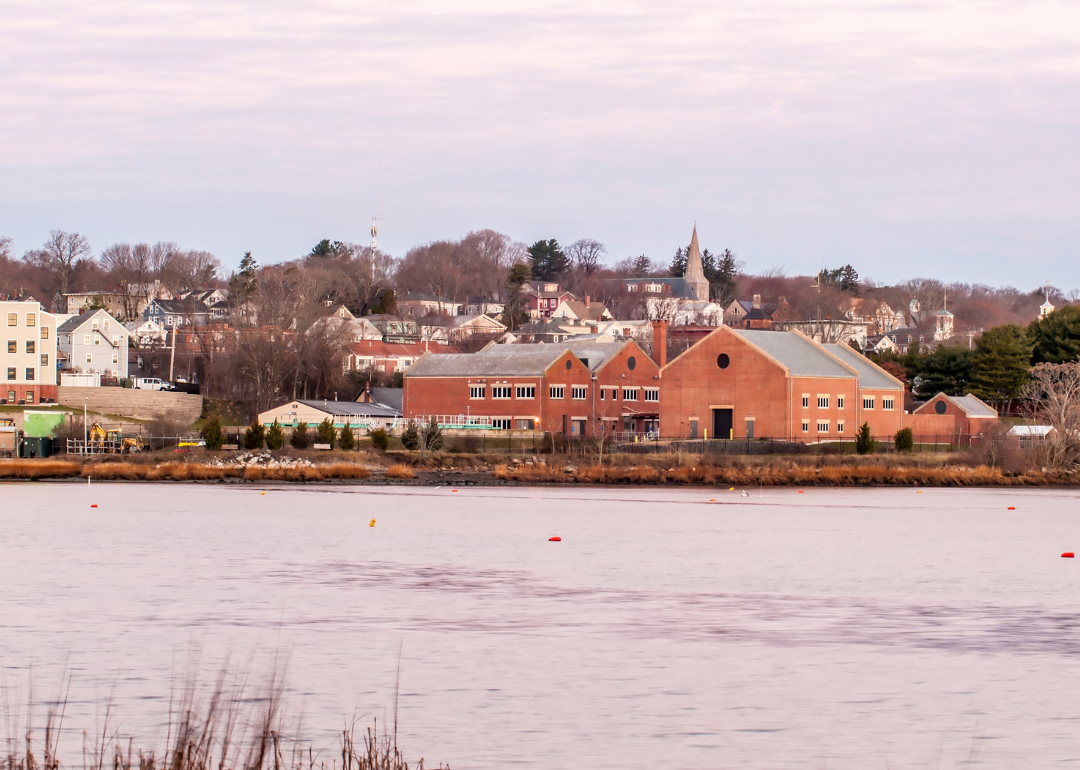
#16. Rhode Island: 25% liberal, 29% conservative

- Most conservative county: Kent County
--- Republican votes in 2020: 42,001 (45.1%)
--- Total votes cast: 93,093

Demographically, Kent County is fairly average, containing parts of the greater Providence metropolitan area as well as rural swaths, and with income, employment, education, and median age levels on par with the national average. The county's tossup nature is reflected in its voting history, going for President Trump by a 0.7% margin in 2016 and President Biden by a 7.6% margin in 2020. Likely tipping the county's balance towards conservatism, however, are the 38% of its population identifying as white Catholics, a group that leans Republican by a 14% margin, as well as a largely white overall population representing 86% of the total 170,363 residents.Kiowa County, Colorado

Jacob Boomsma // Shutterstock

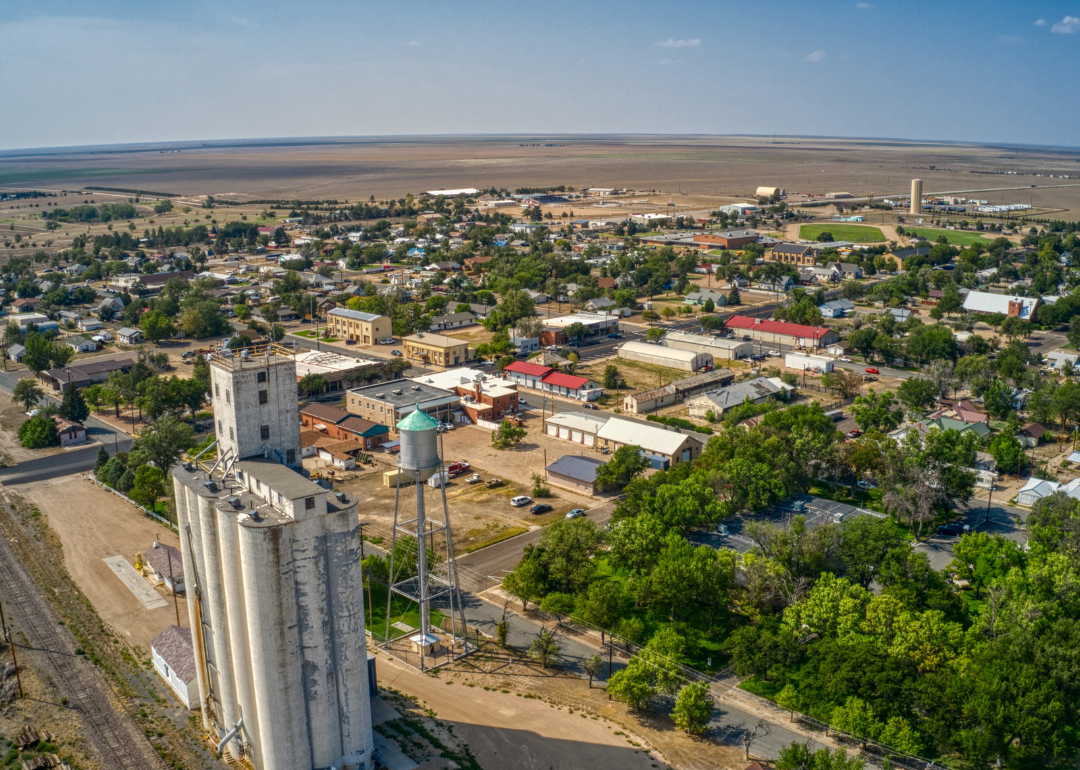
#15. Colorado: 26% liberal, 33% conservative

- Most conservative county: Kiowa County
--- Republican votes in 2020: 795 (88.0%)
--- Total votes cast: 903

The location of a collapsed agriculture industry, Kiowa County is 1,767.8 square miles, but contains only 1,446 residents, making it one of the top 50 least densely populated counties in the nation. With a population that is 75% white and Christian, and overall 89% white, Kiowa's steep conservatism likely comes down to its racial and geographic demographic qualities.Wayne County, Illinois

Canva

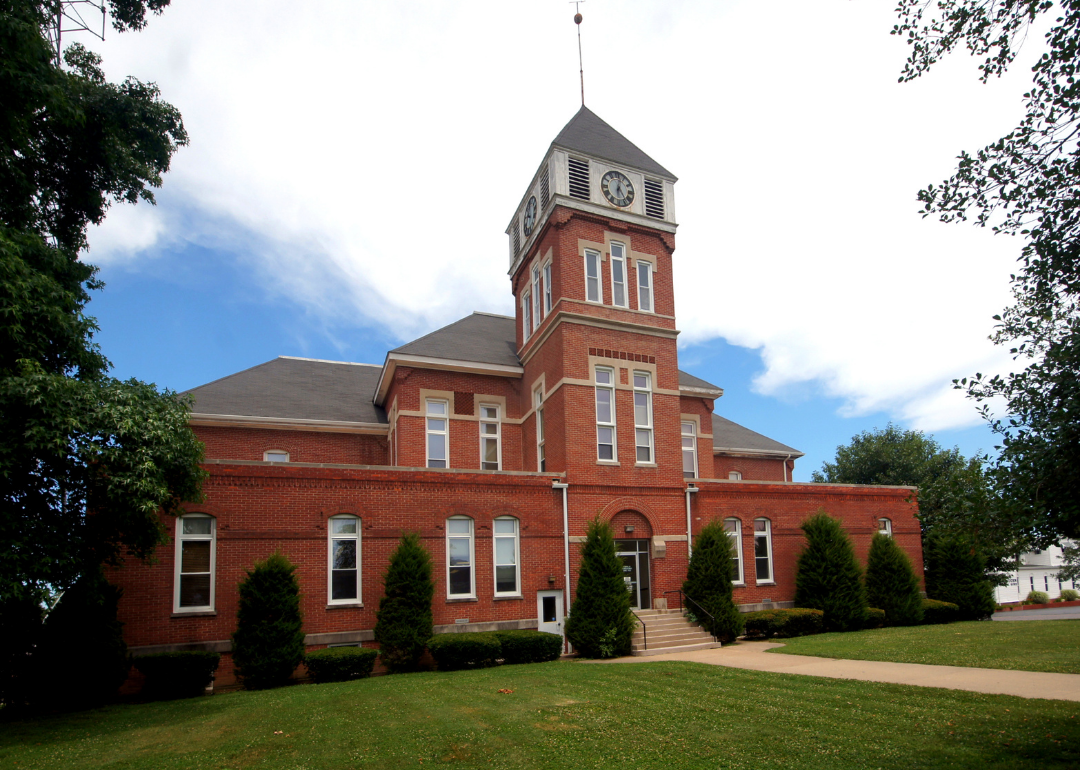
#14. Illinois: 27% liberal, 31% conservative

- Most conservative county: Wayne County
--- Republican votes in 2020: 7,176 (84.4%)
--- Total votes cast: 8,499

Wayne County is host to 368,017 acres of farmland, constituting 80% of the county's 713.8 square miles. Its largest city is Fairfield with a population of 4,883. Eighty-two percent of the county's population of 16,179 are white Christians, and 95.5% of the overall population is white, with the percentage of the population attaining a bachelor's degree or higher at 15.2%, about 20 points lower than the national average.Litchfield County, Connecticut

Canva

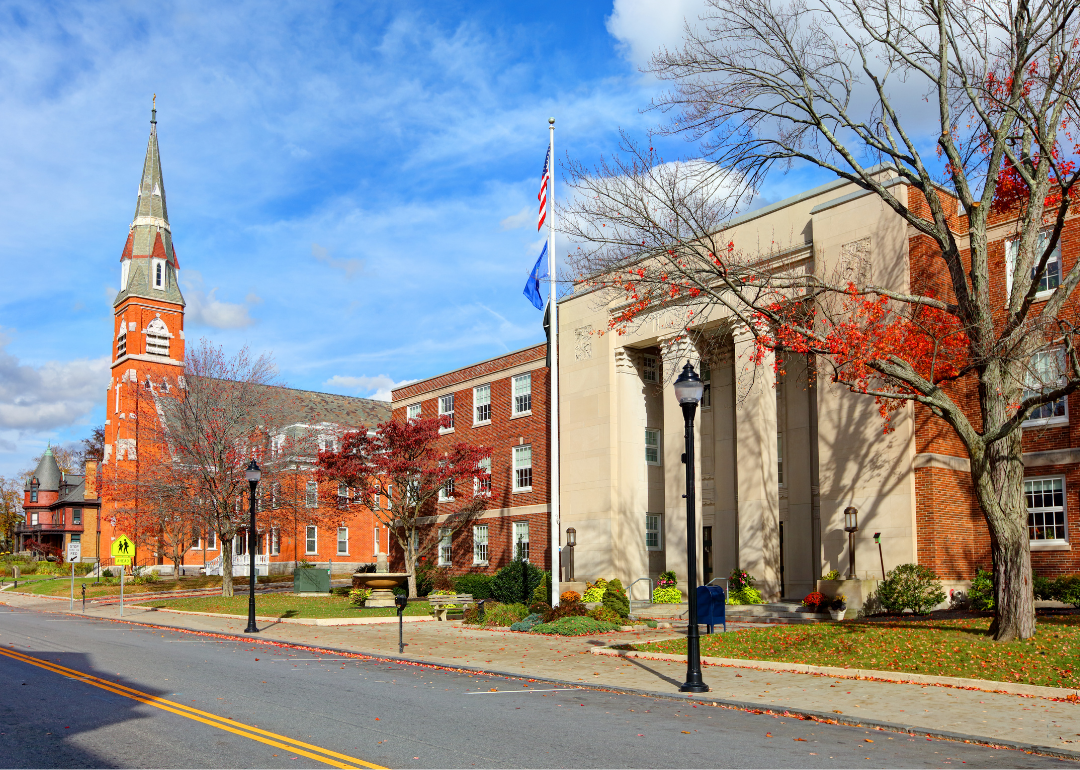
#13. Connecticut: 27% liberal, 30% conservative

- Most conservative county: Litchfield County
--- Republican votes in 2020: 55,601 (51.7%)
--- Total votes cast: 107,544

Connecticut's largest county by square mileage, Litchfield County has a population of 185,186 and contains a consistent distribution of smaller towns interspersed with natural areas and preserves. The county is wealthier than the national average, with a median household income of $84,978 against the nation's $69,717, and more highly educated with 38% of the population attaining a bachelor's degree or higher and 15% attaining a postgraduate or professional degree. Factors contributing to the county's tendency to go for Republican candidates by small but consistent margins are a high median age of 47.6, a population of 85.7% white, and 5% white Christian.Ocean County, New Jersey

Canva

#12. New Jersey: 27% liberal, 29% conservative

- Most conservative county: Ocean County
--- Republican votes in 2020: 217,740 (63.8%)
--- Total votes cast: 341,516

Part of the broader New York metropolitan area, Ocean County is home to 637,229 people and has grown consistently over the decades, gaining 10.5% in population from 2010-2020. The city of Lakewood is a source of much of that increase, growing by 45.6% to a total population of 135,158 from 2010-2020, thanks in large part to an influx of Orthodox Jewish people, a group that leans Republican by 75%. Otherwise, the county's population is 83.8% white, with 10.4% of the population being Hispanic or Latino, and overall has fairly average income, education, and median age demographics.Lake County, Oregon

Dominic Gentilcore PhD // Shutterstock

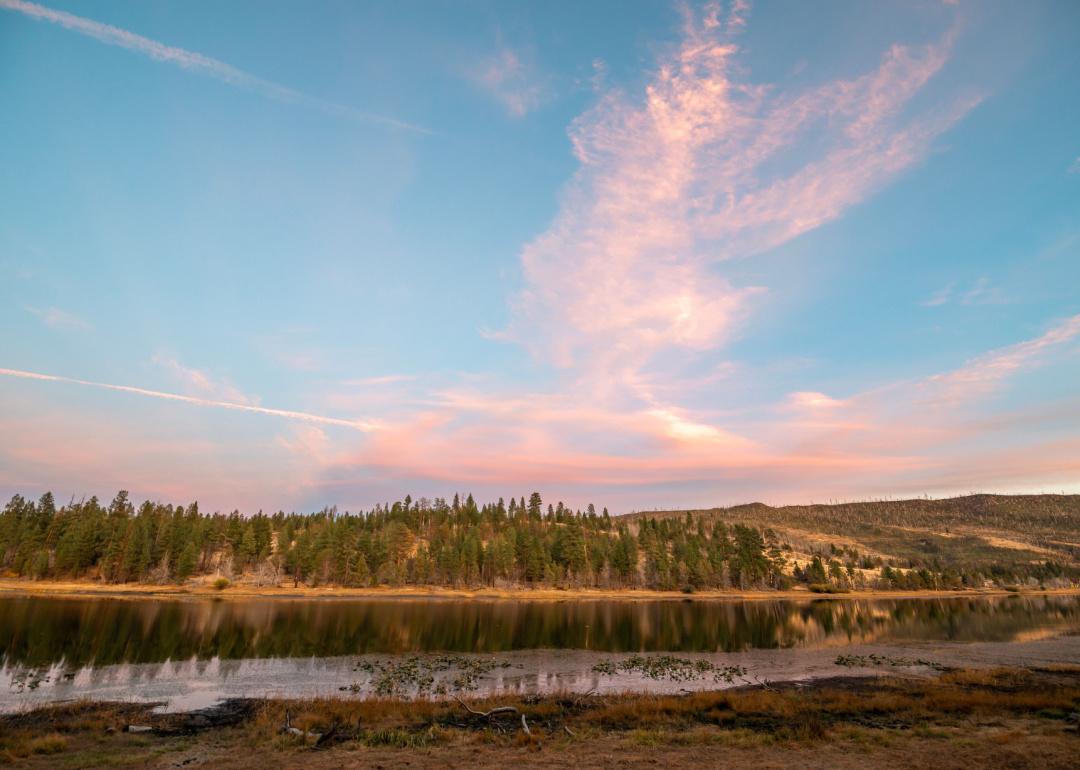
#11. Oregon: 28% liberal, 32% conservative

- Most conservative county: Lake County
--- Republican votes in 2020: 3,470 (79.5%)
--- Total votes cast: 4,363

Located in southern Oregon in a region known as the "Oregon Outback" for its desert habitat, Lake County is 8,138.6 square miles in size and contains a population of 8,160, putting its population density at about 1 person per square mile. A quarter of the population is 65 years and older, and 82% are white with an overall median household income of $50,685, about $20,000 lower than national and state levels.Garrett County, Maryland

Canva

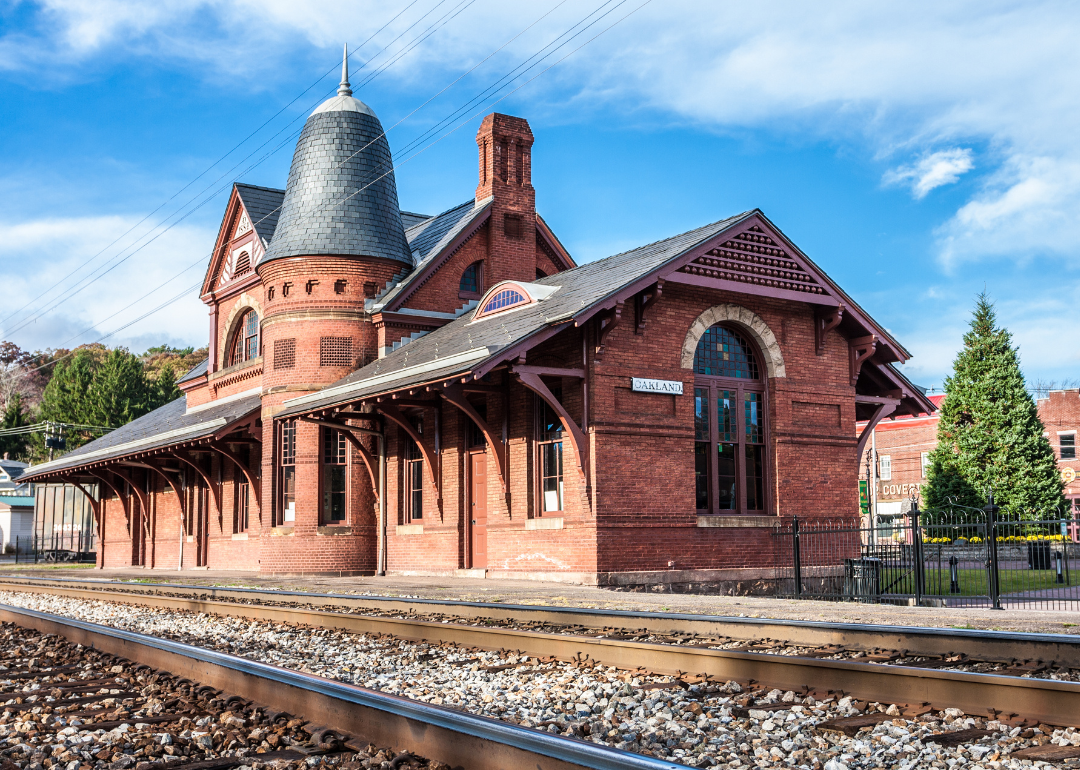
#10. Maryland: 28% liberal, 29% conservative

- Most conservative county: Garrett County
--- Republican votes in 2020: 12,002 (76.9%)
--- Total votes cast: 15,611

Maryland's westernmost county, Garrett County is sandwiched between West Virginia and Pennsylvania and contains 118.75 square miles of parks, lakes, and forestland—about 18% of the county's overall size. The county is overwhelmingly white at 96.5% of 28,806 people and is 71% white Christian, with 23% of residents religiously unaffiliated. The county has a slightly above average median age of 47.3, with 22.4% of the population 65 and older, a median income of $58,011 against the state's $90,203, and 24.7% of residents having attained a bachelor's degree or higher.Honolulu County, Hawaii

Canva

#9. Hawaii: 28% liberal, 22% conservative

- Most conservative county: Honolulu County
--- Republican votes in 2020: 136,259 (35.7%)
--- Total votes cast: 382,114

Containing 70% of Hawaii's residents and encompassing the entirety of the island of Honolulu, Honolulu County has a population of 1,016,508, 43% of whom are Asian or Asian American, 10% of whom are Native Hawaiian and Pacific Islander, and 18.5% of whom are white. In terms of political affiliation, English-speaking Asian Americans lean Democrat by a margin of 55 points, a gap that has continually widened over the last two decades. Religiously, the county is quite diverse—4% of its population is Buddhists, the third-largest concentration of Buddhists in the nation, a group that leans Democrat.Lassen County, California

Canva

#8. California: 29% liberal, 29% conservative

- Most conservative county: Lassen County
--- Republican votes in 2020: 8,970 (74.8%)
--- Total votes cast: 11,985

Located in California's arid northeast, Lassen County has a low employment rate of 30%, though the population's median age is 37.3. Notably, 46% of people employed in the county are local, state, and federal government employees—31.4% higher than the national average—with state and federal prisons located in the region accounting for a significant amount of that number. Only 11.8% of the population has attained a bachelor's degree or higher. The county is relatively diverse when compared to other counties on this list with 64.3% of the population identifying as white, 23% as Hispanic or Latino, 6.9% as Black or African American, and 3.3% as American Indian/Alaskan Native.Belknap County, New Hampshire

Canva

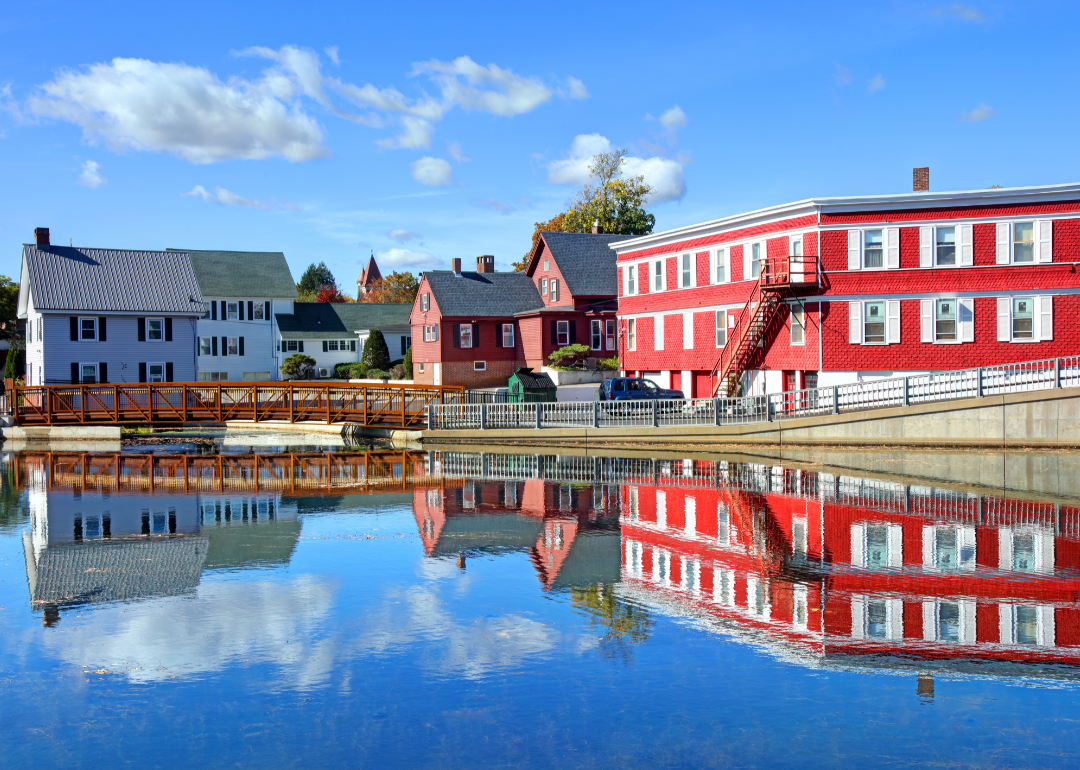
#7. New Hampshire: 30% liberal, 28% conservative

- Most conservative county: Belknap County
--- Republican votes in 2020: 20,899 (54.3%)
--- Total votes cast: 38,453

Host to the majority of Lake Winnipesaukee, 15% of Belknap County's area is water, and its largest city is Laconia, which has a population of 16,871 to the county's 63,705 residents. Significant to the politics of the region is a popular ski resort called Gunstock, which in 2023 led to an upheaval in the county's state delegation after a Republican-led group attempted to usher in corporate ownership of the resort. In terms of its demographics, Belknap contains the highest concentration of white Christians in New Hampshire at 63%, with 92.8% of the overall population identifying as white.Wyoming County, New York

Canva

#6. New York: 30% liberal, 27% conservative

- Most conservative county: Wyoming County
--- Republican votes in 2020: 13,348 (74.0%)
--- Total votes cast: 18,050

Located in far western New York, Wyoming County is the state's largest dairy farming county, containing an estimated 49,925 cows, per the USDA's 2017 Census of Agriculture. The county also contains the third-highest concentration of white Christians in the state at 67% of the population and of that 22% are white evangelical Protestants, a group that leans Republican by a margin of 59 points.Washington D.C.

Canva

#5. Washington D.C.: 30% liberal, 24% conservative

- Most conservative county: Washington
--- Republican votes in 2020: 18,586 (5.4%)
--- Total votes cast: 344,356

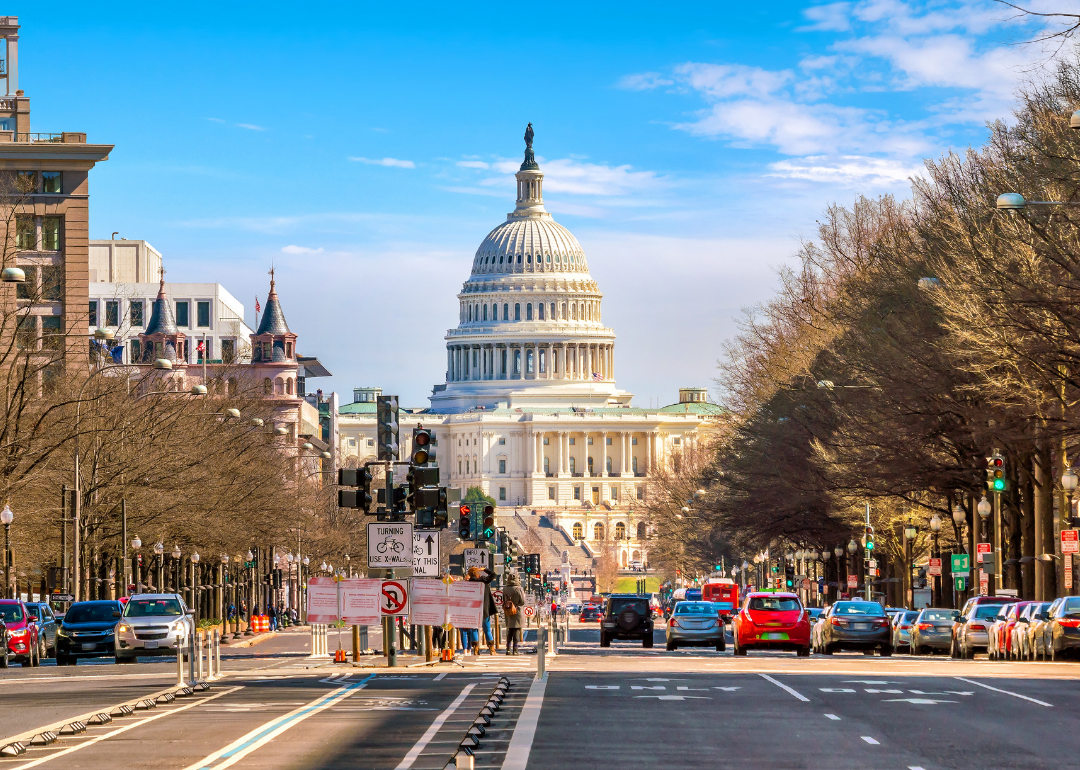
As a federal district and not a state, Washington D.C. does not contain any official counties, but its local government performs the services of a city and county. A region that votes overwhelmingly Democratic and has since at least 1964, D.C.'s conservatism is difficult to identify. Notably, 63% of D.C. residents have attained a bachelor's degree or higher and 35.9% have attained a graduate or professional degree. The region is also very diverse with a population of 689,545 breaking down to 41.4% Black or African American, 39.6% white, 11.3% Hispanic or Latino, and 4.8% Asian.Lincoln County, Washington

Arpad Jasko // Shutterstock

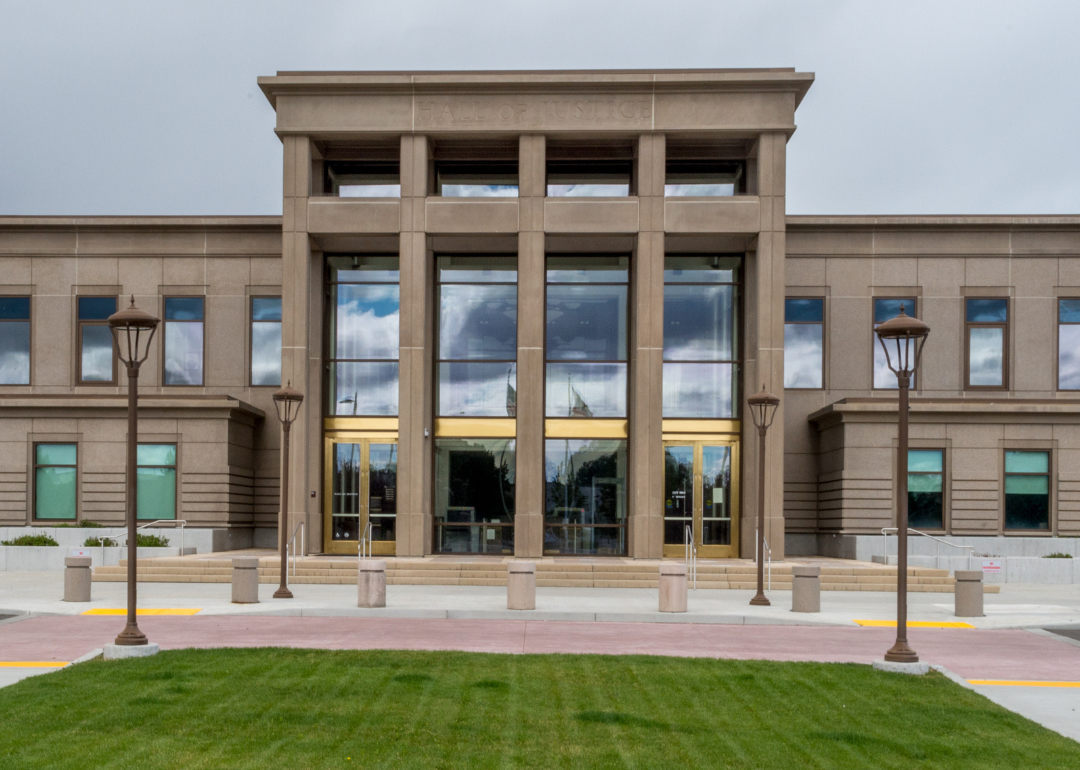
#4. Washington: 31% liberal, 28% conservative

- Most conservative county: Lincoln County
--- Republican votes in 2020: 5,150 (73.2%)
--- Total votes cast: 7,033

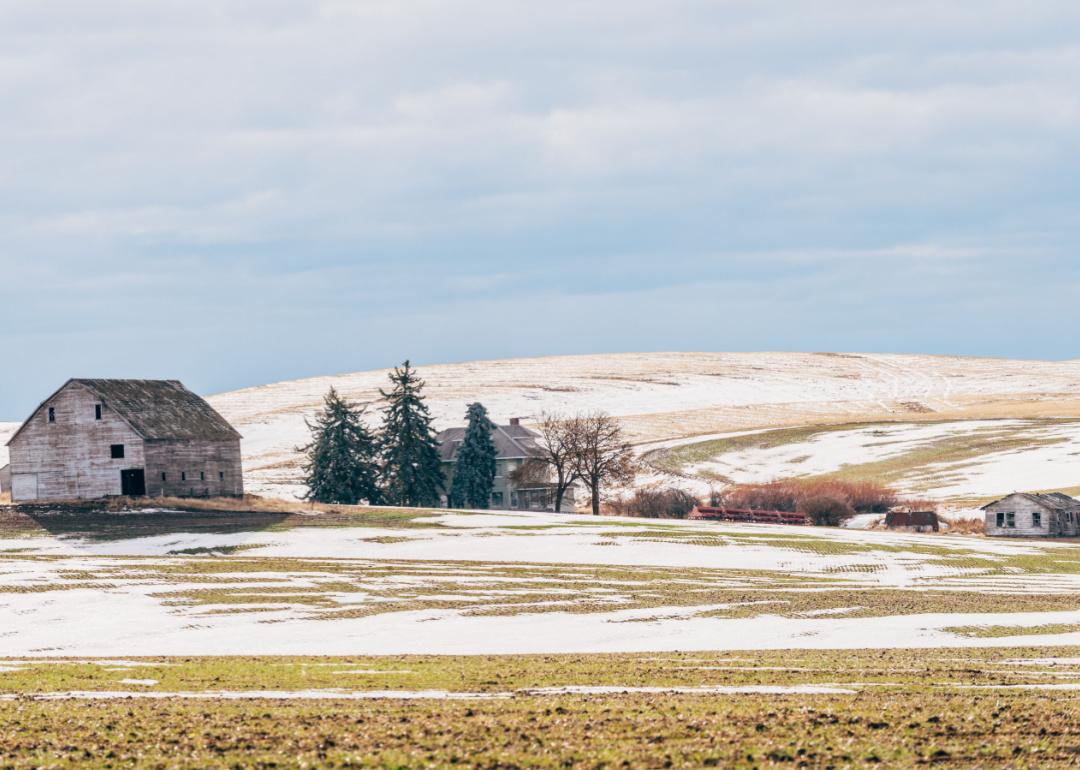
Located in Washington's eastern region, Lincoln County is the state's second-largest wheat producer, with over 80% of the county's 2,310 square miles devoted to farmland. The county is sparsely populated, with a population density of 4.7 people per square mile, and its residents have a somewhat high median age of 47.1, with 25.1% of the population 65 or older. Lincoln's population is 89.2% white, and the county has the highest concentration of white Christians in the state at 67%.Essex County, Vermont

Canva

#3. Vermont: 32% liberal, 28% conservative

- Most conservative county: Essex County
--- Republican votes in 2020: 1,773 (53.9%)
--- Total votes cast: 3,288

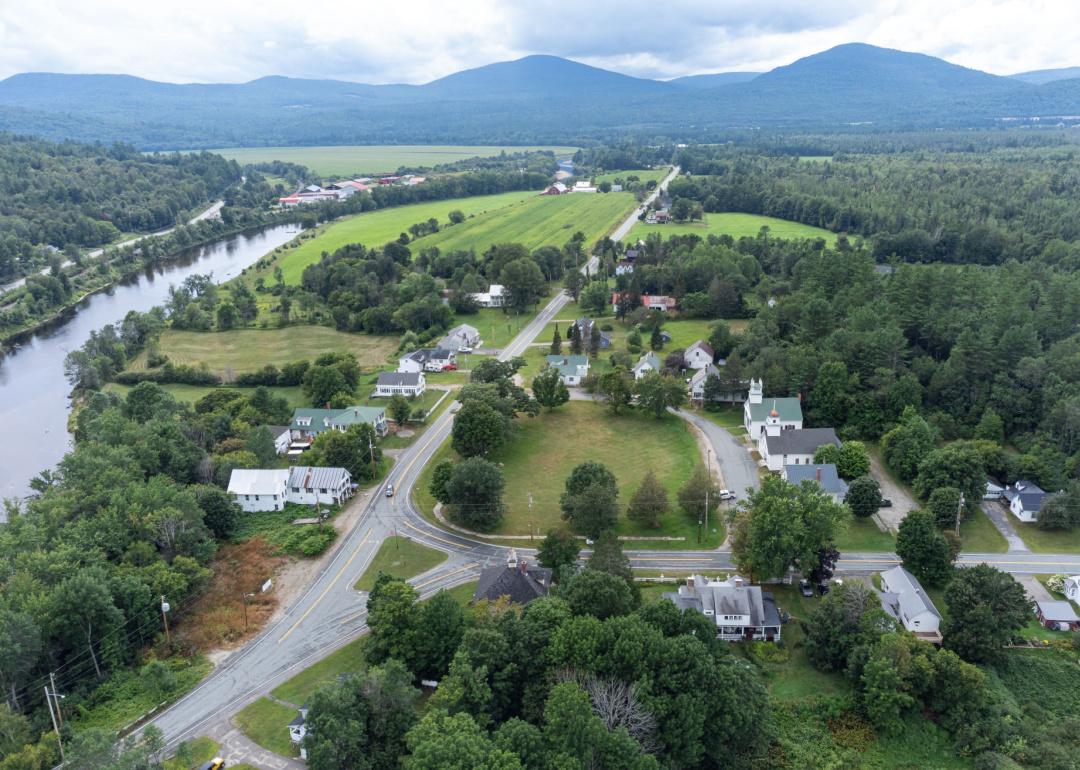
The least populous county of Vermont and in all of New England, Essex County has 5,920 residents, of whom 94% are white, and 67% of whom identify as white Christians, the third-highest concentration in the state. Essex also has the lowest median household income in the state at $48,194 against Vermont's overall $72,431.Piscataquis County, Maine

Canva

#2. Maine: 33% liberal, 35% conservative

- Most conservative county: Piscataquis County
--- Republican votes in 2020: 6,143 (62.0%)
--- Total votes cast: 9,908

With water representing 9.5% of its area, and a significant portion of its land devoted to state parks, preserves, and wilderness areas, Piscataquis County is a largely rural, natural region. The second-largest county in Maine at 3,961 square miles, Piscataquis' population of 16,800 has a median age of 51.3, with 26.1% of the population aged 65 and older, and 20.3% of the population having attained a bachelor's degree or higher.Bristol County, Massachusetts

Canva

#1. Massachusetts: 35% liberal, 21% conservative

- Most conservative county: Bristol County
--- Republican votes in 2020: 119,872 (42.9%)
--- Total votes cast: 279,279

Bordering Providence, Rhode Island, and containing a high proportion of urban area, Bristol County's population is 579,200, and the county has a population density of 1,047.2 people per square mile. The county's median household income of $73,102 is above the national average but lags behind Massachusetts' median income of $89,645. Just 9.5% of the population are Hispanic or Latino, whereas 78.7% identify as white.​​

Data reporting by Sam Larson. Story editing by Brian Budzynski. Copy editing by Robert Wickwire.

_____
Comment below or email editors@thehustings.news
By Bryan Williams

In thinking about this column, I tried to find a theme. The one that kept coming to my mind was “Let the chips fall where they may.” Ever since it became clear in early November 2020 that President Trump had lost the election, he and many Republicans have gone on a journey of lawsuits and arm-twisting with a goal of making those chips fall where they wanted them to.

Trump and the loyal Republicans in Washington spent the last two months losing the Georgia Senate runoff. What did they expect when they blurted out, “Don’t vote because the system is rigged, but please vote to defeat these socialist Democrats?” Huh?

I voted for Trump in November and I didn’t hold my nose. He won me over because I was able to separate Twitter Trump from the Trump who presides. I generally agreed with his policies. He cut taxes. He was prudent with the use of the military. He confronted China and engaged North Korea’s Kim Jong-un (with mixed results, but hey, he did more than most other presidents). Trump’s administration got us out of the Paris Climate Accord and Iran Nuclear Deal, which I think were both stinkers. He also had much success in advancing peace in the Middle East.

Then he lost in November and Twitter Trump took over and the wheels really fell off. Georgia voters noticed, and to their credit, organizers there were able to turn out the Democratic vote in volume not seen in decades.

It wasn’t all Trump’s fault. Incumbents Kelly Loeffler and David Perdue were weak candidates in my opinion. Loeffler is a rich white woman who was appointed and never chosen by Georgia voters, to begin with. Perdue refused to debate Ossoff, which was a huge mistake. Also, my theory that the younger or more vigorous candidate usually wins held true in the case of Democratic challenger Jon Ossoff.

So now we have government run by the Democrats. It wasn’t inevitable, but Trump and his loyal Republicans made it inevitable with their odd behavior of the past two months. Will the Dems muck it up with their newfound power? As the outgoing President said so often, “We’ll see.”

By Bryan Williams In thinking about this column, I tried to find a theme. The one that kept […]

By Andrew Boyd

I struggle to talk about these debates in the fashion of the day, as if we were watching something as superficial as a UFC bout; but as political heavyweight contests go, there were no big surprises. Adopting as non-partisan perspective as I can manage, I thought both men got in their shots, but the roundhouses were few and far between, and neither combatant went face-to-canvas. 

Trump’s best line of attack was the right hook to Joe’s legacy as a careerist pol, and the watery, flavorless stone soup of ‘accomplishments’ over 47 long years that should do little to satiate anyone’s desire for a candidate possessed of the capacity, desire or will to affect meaningful change in any direction. 

If fate elects Joe, I’ll take what solace I can in the fact that he’s no ideologue and mostly just a guy looking to fill out his political butterfly collection with the rare Potus-excremus.  Nothing new, certainly nothing better, but probably no worse than business as usual.

I’m in the species of conservative who thinks Washington is rotten down to its core, whose vote for Trump was a message to the D.C. establishment, left, right and center, that the game is up.  And it’s that same disgust for Washington’s three-card monte that will pull the lever for DJT once again.  

I think Donald, for all his many foibles, has a genuine love of country and a desire to do the right thing by his countrymen and women. That, for me, is the trump card in a deck full of one-eye jacks.  Establishment Washington wouldn’t know a straight deal if they saw one; and worse yet, if they did, they’d form a posse to hang that dealer, which is more or less what played out as the Mueller probe over the past three years.  

Get in there Donald and break some shit!

Please email your comments to editors@thehustings.news
—–